Shop-level Performance (GAds + GA4)
Shop-level Performance (GAds + GA4)
Shop-level Performance (GAds + GA4)
Simple daily performance overview of your main KPIs
Simple daily performance overview of your main KPIs
Simple daily performance overview of your main KPIs
Highlights:
Unified revenue, cost, and profit trends across Google Ads and Meta
Real-time ROAS and Net Contribution Margin tracking
Visual profit diagnostics by day with contextual performance metrics
Auto-highlighting of major PoP (Period-over-Period) or YoY shifts
Drillable daily views with dynamic cost, CPC, CPA, AOV, CVR%, and ROI
Clear, CFO/CMO-level view of paid media profitability
Built-in margin logic: calculates avg. profit, not just ROAS
Day-of-week trend analysis for seasonality or promo impact
Plug-and-play integration with GA4 & Google Ads native connectors
The Google Ads Overview page is your real-time command center for understanding the big picture of paid media performance—without getting lost in spreadsheets or tab chaos.
At the very top, you get key performance metrics that matter:
Spend
Revenue
ROAS
Net Contribution Margin
ROI on Contribution Margin
This isn’t just vanity ROAS. This view shows real profitability—integrating cost, revenue, and contribution margin to help you assess performance at a glance.
Note: Contribution margin is calculated based on your average gross margin, not per-order data.
The lower section presents an interactive daily trend graph, letting you compare:
Cost (Google + Meta)
Revenue (Eshop-wide)
Net Profitability (in €)
And to top it off, the data table lets you filter by date, spot peaks, and outliers, and understand which days or campaigns might be underperforming despite having good surface-level ROAS.
Whether you’re the one running the ads or reporting to the CEO, this page helps you answer:
“Are we profitable this week?”
“Are we spending too much for what we’re getting?”
“What days are draining budget vs generating margin?”
It’s not a report. It’s your daily profit radar.
Other Master Dashboard Pages
Other Master Dashboard Pages
Check out all the pages included in the Master Bundle:
Check out all the pages included in the Master Bundle:
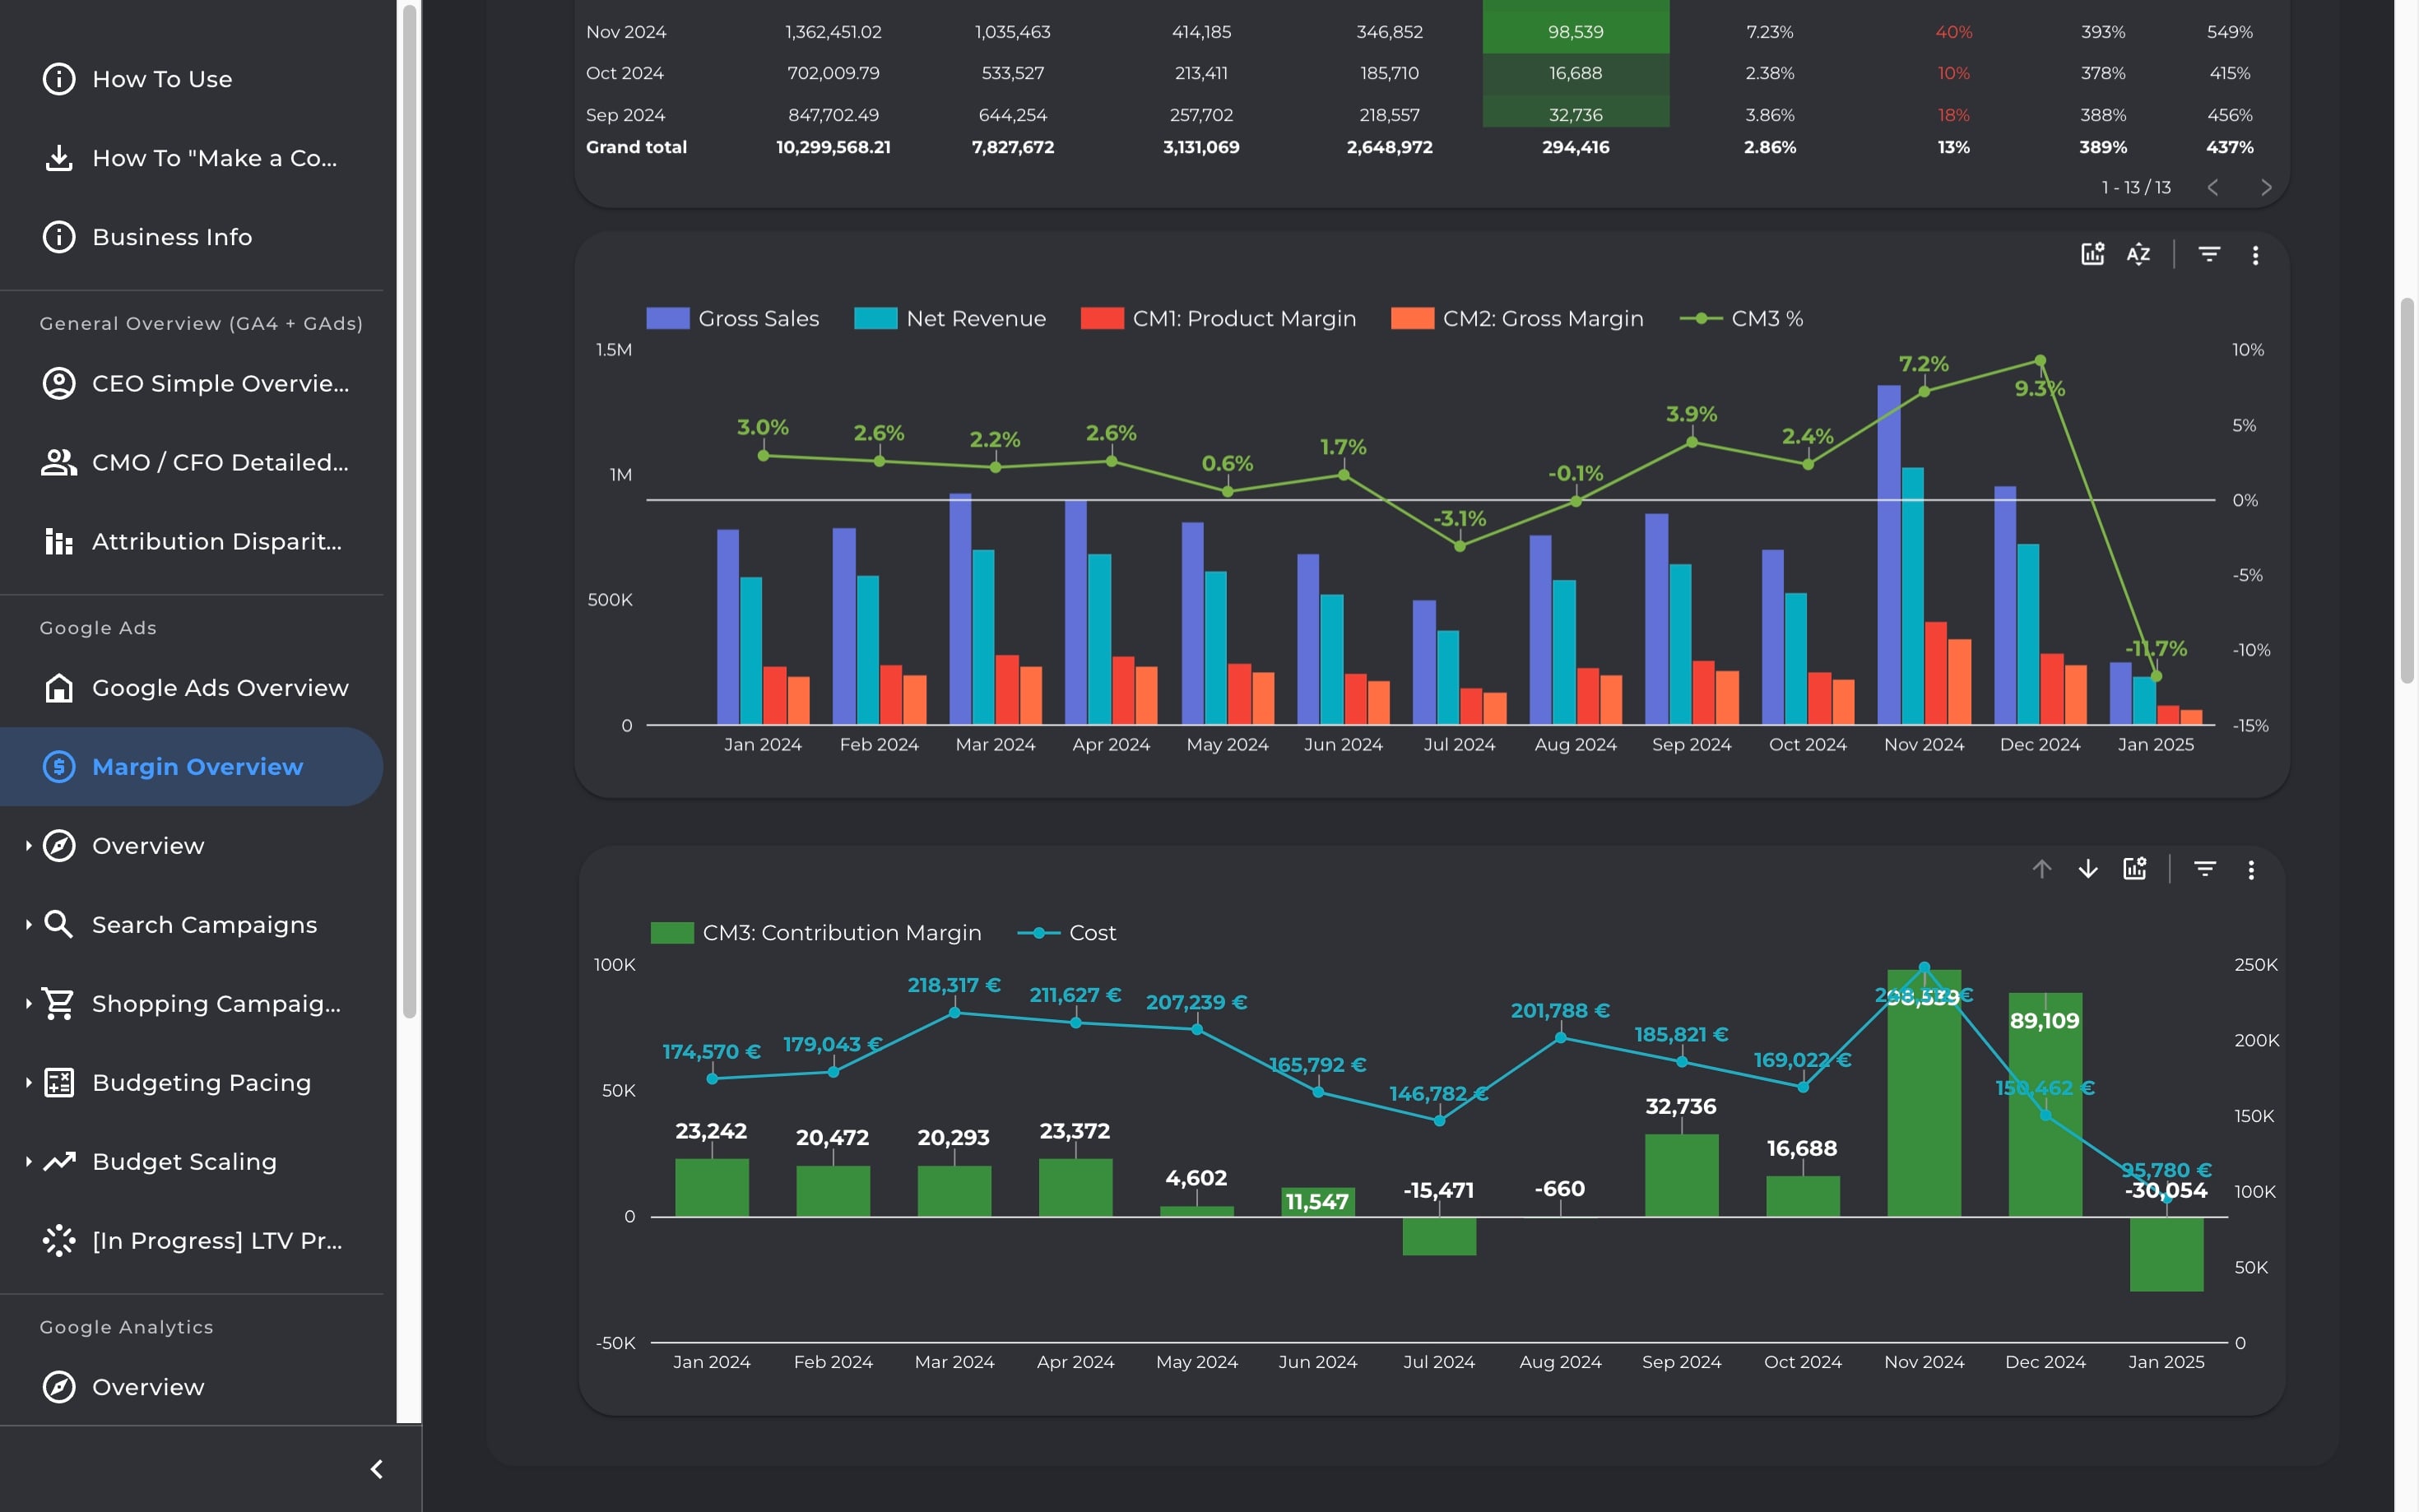
Visualize the full flow from sales to profit with a 3-tier margin breakdown. Estimate contribution margin and break-even ROAS to make smarter, finance-aligned marketing decisions.
Visualize the full flow from sales to profit with a 3-tier margin breakdown. Estimate contribution margin and break-even ROAS to make smarter, finance-aligned marketing decisions.
Visualize the full flow from sales to profit with a 3-tier margin breakdown. Estimate contribution margin and break-even ROAS to make smarter, finance-aligned marketing decisions.
Visualize the full flow from sales to profit with a 3-tier margin breakdown. Estimate contribution margin and break-even ROAS to make smarter, finance-aligned marketing decisions.
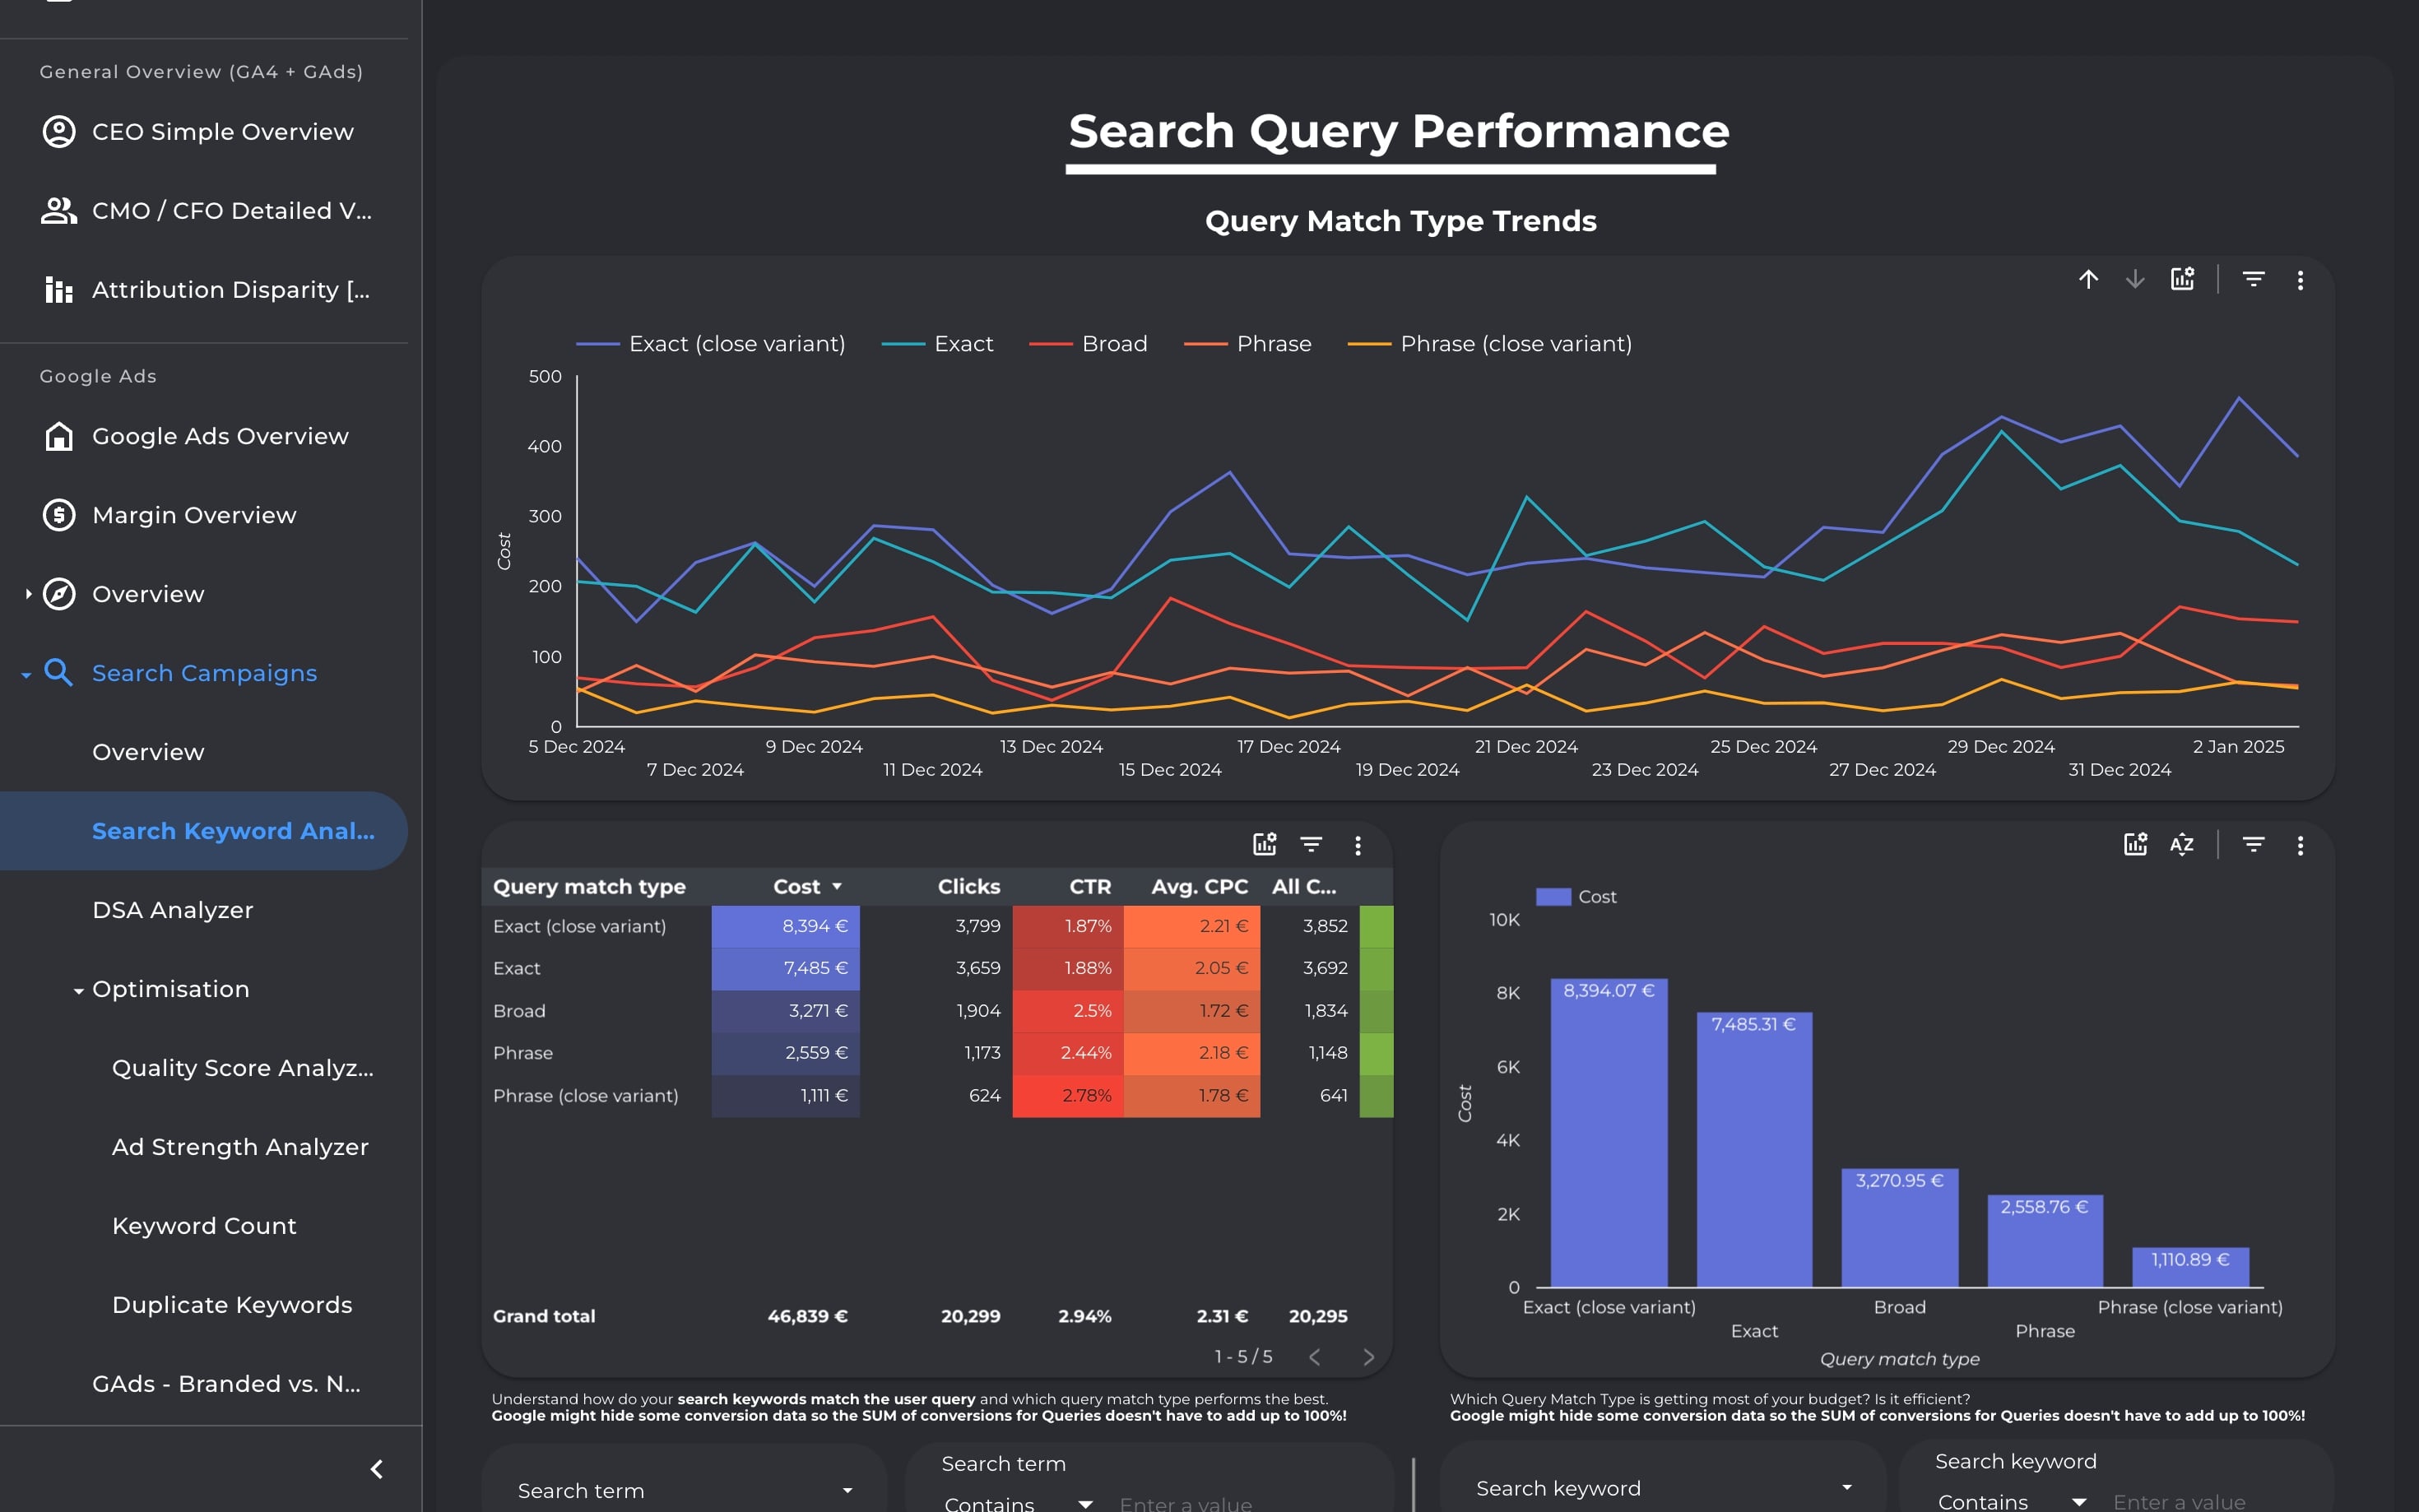
Diagnose and optimize your Search Ads campaigns from every angle—keywords, queries, match types, DSA, structure, and scoring. Identify waste, improve ROI, and simplify with data-backed decisions.
Diagnose and optimize your Search Ads campaigns from every angle—keywords, queries, match types, DSA, structure, and scoring. Identify waste, improve ROI, and simplify with data-backed decisions.
Diagnose and optimize your Search Ads campaigns from every angle—keywords, queries, match types, DSA, structure, and scoring. Identify waste, improve ROI, and simplify with data-backed decisions.
Diagnose and optimize your Search Ads campaigns from every angle—keywords, queries, match types, DSA, structure, and scoring. Identify waste, improve ROI, and simplify with data-backed decisions.
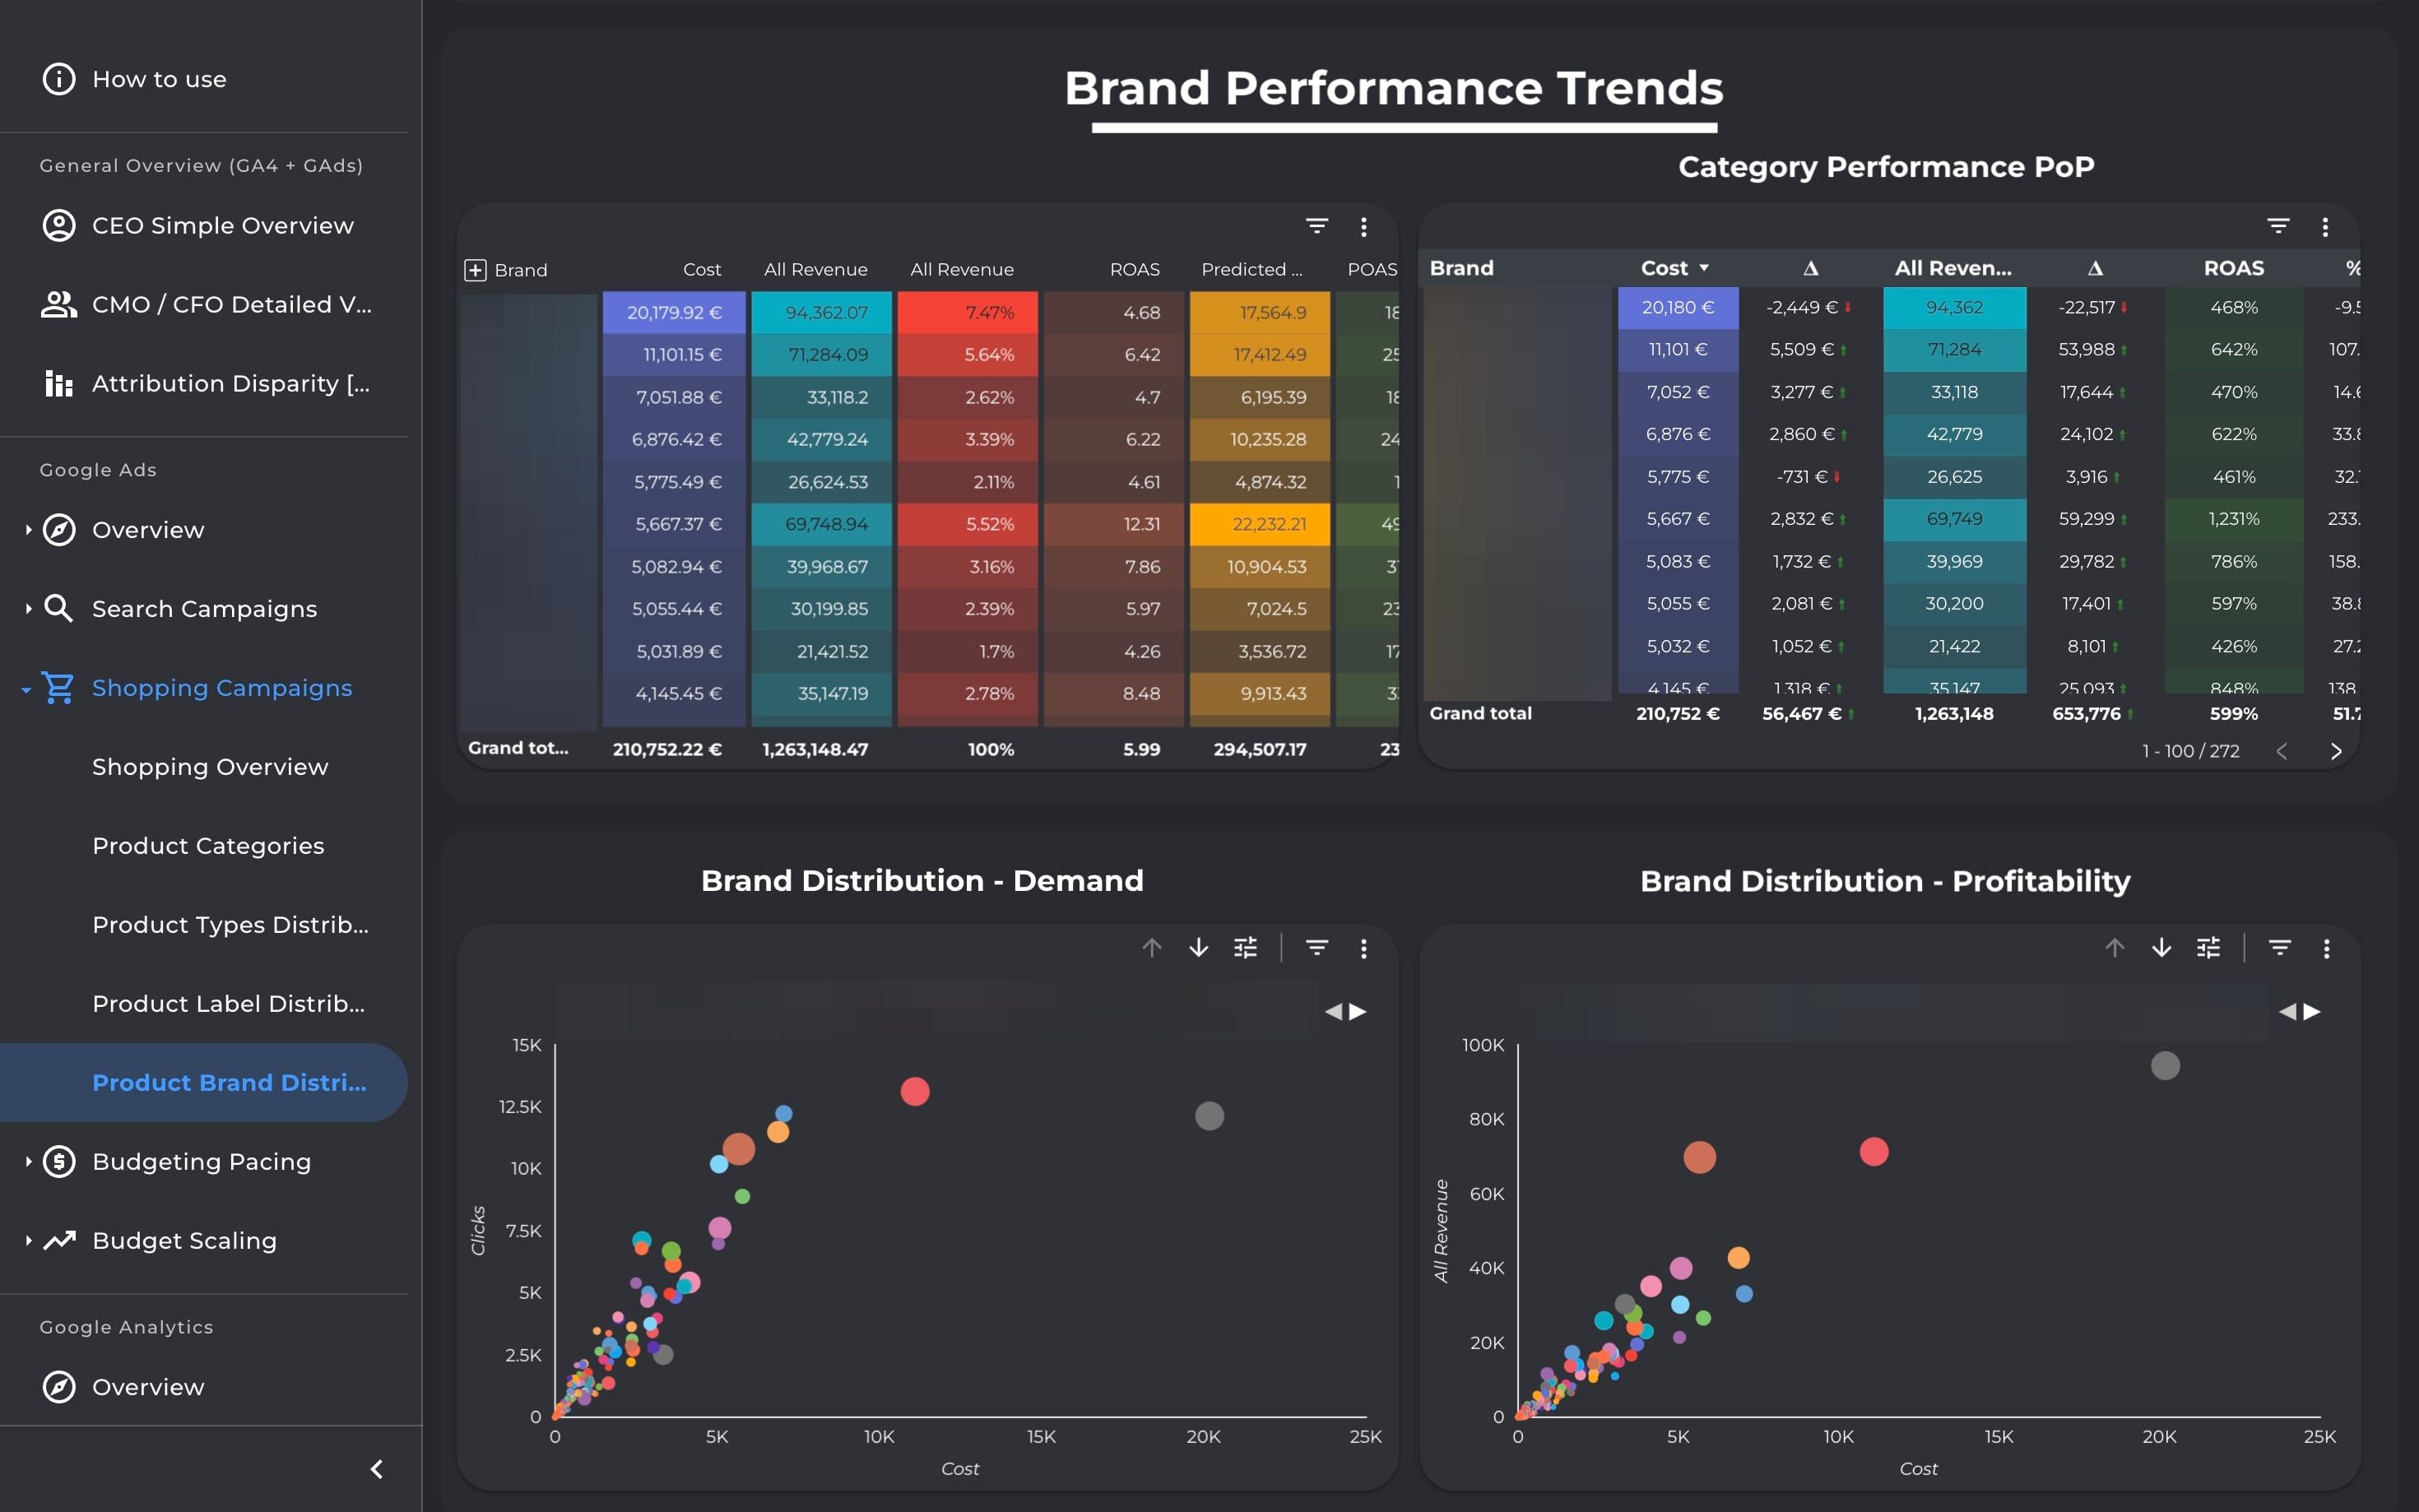
Analyze Shopping & PMax campaign profitability at product level. Drill into categories, brands, and labels to surface bestsellers, optimize structures, and align spend with scalable, high-margin products.
Analyze Shopping & PMax campaign profitability at product level. Drill into categories, brands, and labels to surface bestsellers, optimize structures, and align spend with scalable, high-margin products.
Analyze Shopping & PMax campaign profitability at product level. Drill into categories, brands, and labels to surface bestsellers, optimize structures, and align spend with scalable, high-margin products.
Analyze Shopping & PMax campaign profitability at product level. Drill into categories, brands, and labels to surface bestsellers, optimize structures, and align spend with scalable, high-margin products.