Margin Overview – Profitability Tracking for Google Ads
Margin Overview – Profitability Tracking for Google Ads
Margin Overview – Profitability Tracking for Google Ads
From Revenue to Contribution Margin - See What You Really Keep
From Revenue to Contribution Margin - See What You Really Keep
From Revenue to Contribution Margin - See What You Really Keep
Highlights:
Monthly breakdown of Gross Sales, Net Revenue, and Marketing Profit
CM1, CM2, CM3: Product, Gross, and Contribution Margin tiers
Contribution Margin based on average gross margin inputs
Break-even ROAS vs. Actual ROAS visualization
Predictive margin tracking to guide tROAS bidding
Clean vertical analysis of profit flow (top-down view)
CM3 POAS metric for margin-return vs spend
Year-over-year and month-over-month variance indicators
Simple inputs: VAT, returns, shipping, fulfillment, COGS, fees
Designed for CMO/CFO collaboration and budget justification
The Margin Overview page gives you a clear answer to the question every CMO and CFO cares about: “How profitable is our advertising?”
While ROAS is helpful, it’s not enough. This report breaks down your revenue into real margins—helping you understand not just what you earned, but what you actually kept.
We separate margin into three stages:
CM1: Product Margin – Revenue after COGS
CM2: Gross Margin – After fulfillment and transaction fees
CM3: Contribution Margin – After subtracting Google Ads spend
🟢 Note: CM3 is calculated using average inputs (shipping, return rate, VAT, transaction fees, etc.) to estimate profit. It’s not per-order precise—but it’s close enough to drive high-value decisions.
In addition to margin tiers, this view gives you:
Break-even ROAS for each month
CM3 POAS (Profit over Ad Spend) to measure true efficiency
Trends over time in sales, revenue, and profitability
One-click visibility into performance across months
You’ll quickly spot:
Which months were unprofitable (even with strong ROAS)
Where efficiency improved or declined
How much room you have for scaling before margins drop
This is a boardroom-ready report that turns marketing performance into financial storytelling—essential for budget conversations, scaling decisions, and agency transparency.
Other Master Dashboard Pages
Other Master Dashboard Pages
Check out all the pages included in the Master Bundle:
Check out all the pages included in the Master Bundle:
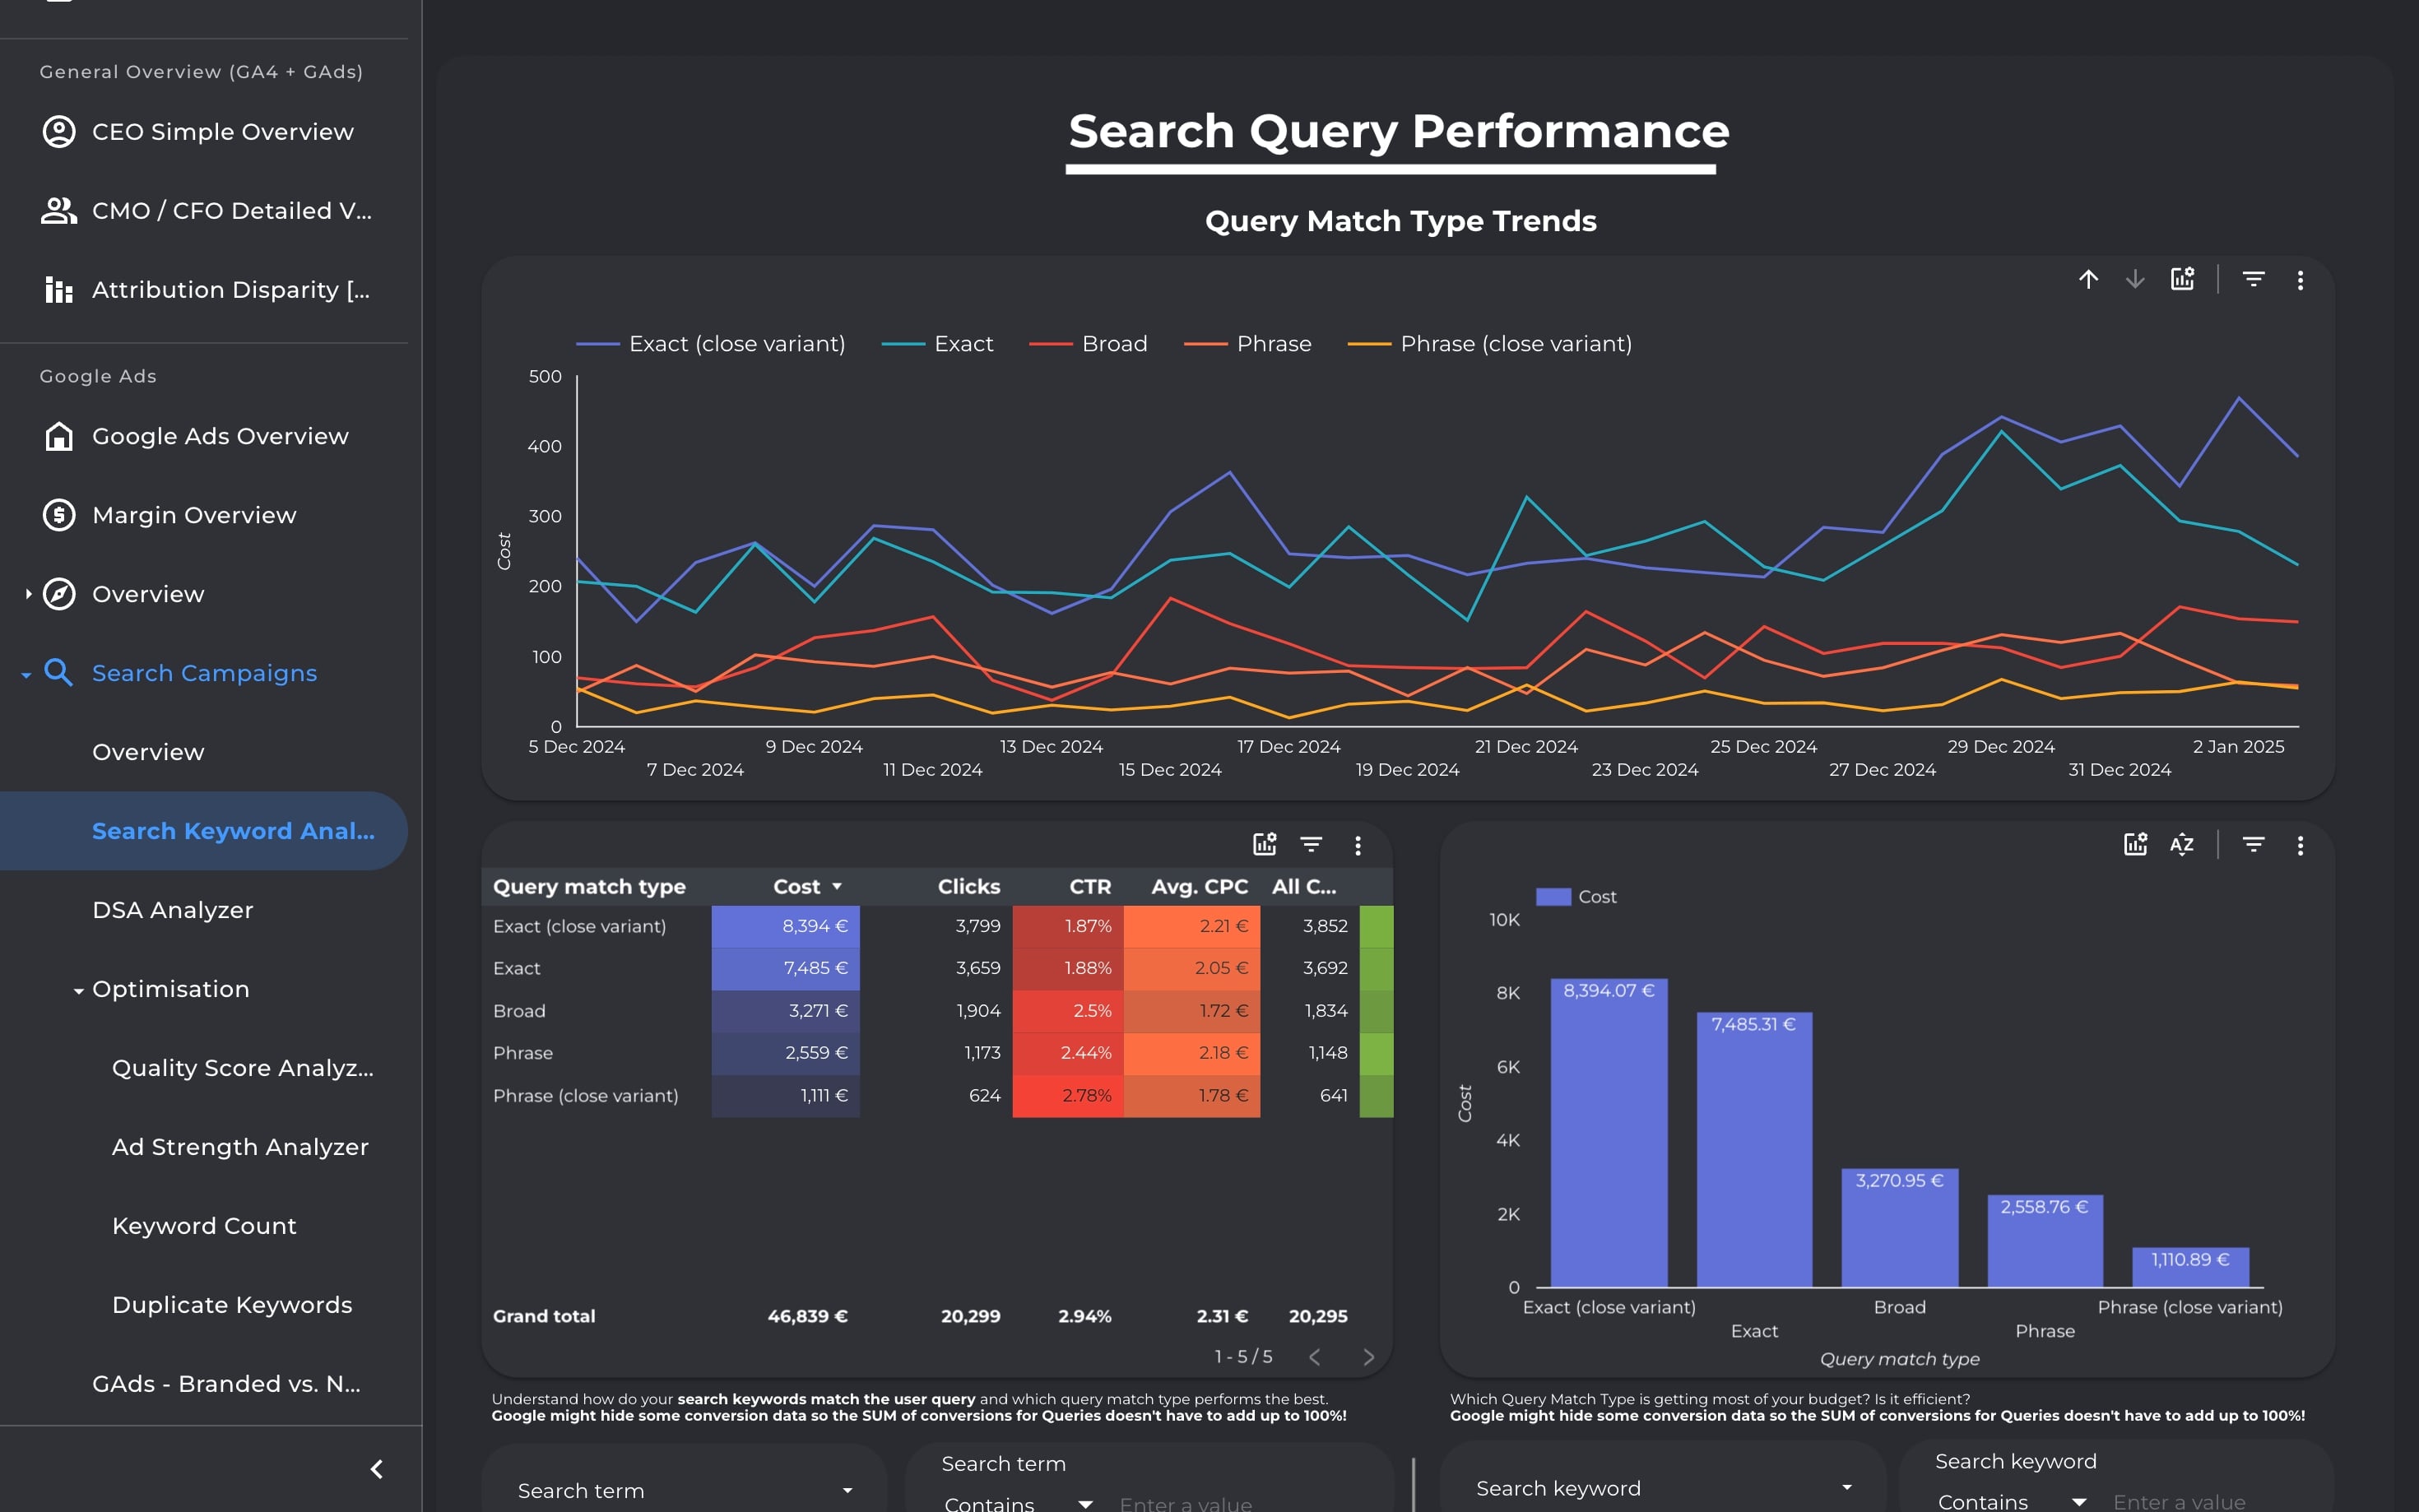
Diagnose and optimize your Search Ads campaigns from every angle—keywords, queries, match types, DSA, structure, and scoring. Identify waste, improve ROI, and simplify with data-backed decisions.
Diagnose and optimize your Search Ads campaigns from every angle—keywords, queries, match types, DSA, structure, and scoring. Identify waste, improve ROI, and simplify with data-backed decisions.
Diagnose and optimize your Search Ads campaigns from every angle—keywords, queries, match types, DSA, structure, and scoring. Identify waste, improve ROI, and simplify with data-backed decisions.
Diagnose and optimize your Search Ads campaigns from every angle—keywords, queries, match types, DSA, structure, and scoring. Identify waste, improve ROI, and simplify with data-backed decisions.
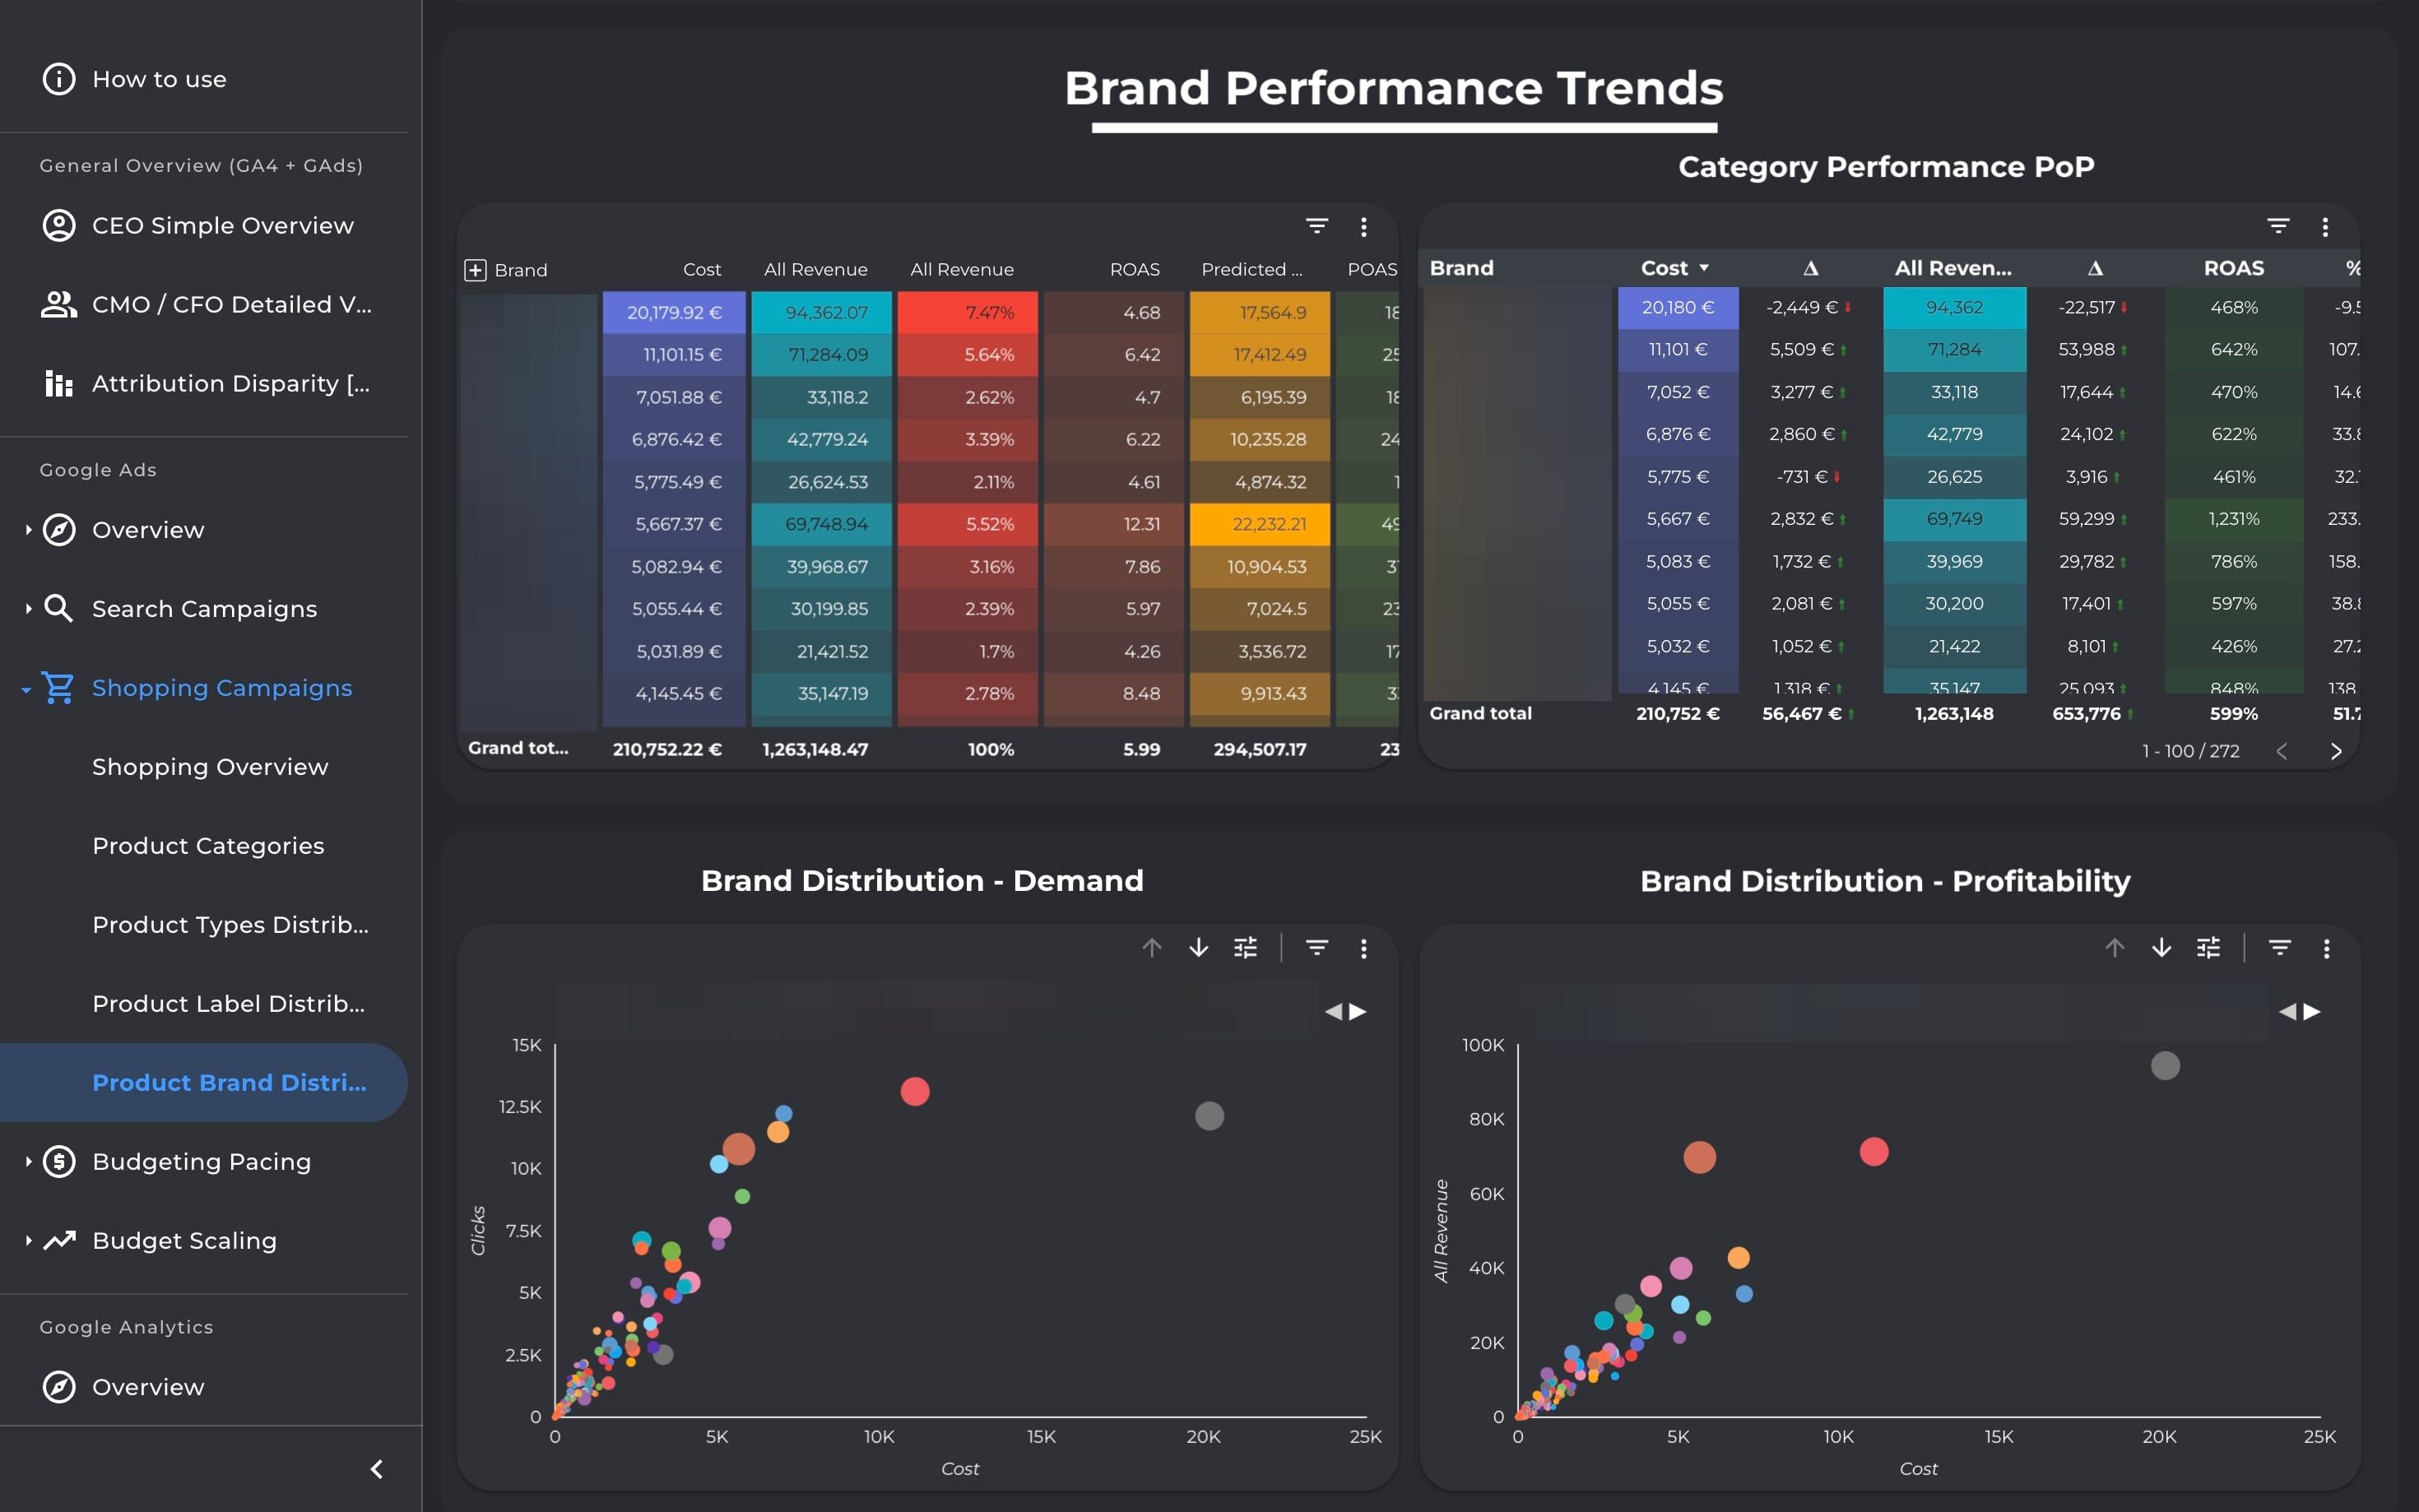
Analyze Shopping & PMax campaign profitability at product level. Drill into categories, brands, and labels to surface bestsellers, optimize structures, and align spend with scalable, high-margin products.
Analyze Shopping & PMax campaign profitability at product level. Drill into categories, brands, and labels to surface bestsellers, optimize structures, and align spend with scalable, high-margin products.
Analyze Shopping & PMax campaign profitability at product level. Drill into categories, brands, and labels to surface bestsellers, optimize structures, and align spend with scalable, high-margin products.
Analyze Shopping & PMax campaign profitability at product level. Drill into categories, brands, and labels to surface bestsellers, optimize structures, and align spend with scalable, high-margin products.

Analyze how performance changes with increased budget using regression analysis. Predict breakeven and find the sweet spot to scale or pause campaigns.
Analyze how performance changes with increased budget using regression analysis. Predict breakeven and find the sweet spot to scale or pause campaigns.
Analyze how performance changes with increased budget using regression analysis. Predict breakeven and find the sweet spot to scale or pause campaigns.
Analyze how performance changes with increased budget using regression analysis. Predict breakeven and find the sweet spot to scale or pause campaigns.