Shopping Campaign Analyzer – Products, Labels, Brands & Profitability
Shopping Campaign Analyzer – Products, Labels, Brands & Profitability
Shopping Campaign Analyzer – Products, Labels, Brands & Profitability
The Product-Level Profits Behind Your Shopping & PMax Spend
The Product-Level Profits Behind Your Shopping & PMax Spend
The Product-Level Profits Behind Your Shopping & PMax Spend
Highlights:
Shopping & PMax campaign overview with PoP/YoY comparison
Product-level data: Revenue, ROAS, Profitability
Category breakdowns from L1 to L5 for granular control
Brand performance visualized with scatter plots and timelines
Product Label analysis (e.g., discounts, sales flags, stock status)
Detect high-cost low-return products or hidden heroes
Contribution margin and POAS estimates based on avg. gross margin
Built-in filters for category, brand, product type, and labels
Highlight discounted or seasonal products with trend overlays
Aligns with feed-based campaign segmentation and scaling
This report gives you full visibility into how your product catalog is performing inside Shopping and Performance Max campaigns.
You start with a high-level view of:
Cost
Revenue
ROAS
Predicted Gross Profit
POAS (profit over ad spend)
Then drill down by:
Category levels (L1–L5)
Product Types
Product Labels (e.g., discount flags)
Brand
Use detailed filters and PoP/YoY comparisons to identify:
Which product segments are driving most of the revenue
Where you’re burning spend on unprofitable items
How promotions (via labels) affect profitability
Whether certain brands or categories deserve more budget or exclusions
You can also see scatter plots and time-series graphs to visualize trends like:
High ROAS with low volume (scale potential)
Big spikes in discounted product spend
Underperformance by stock or label types
Whether you’re running feed-only Shopping or full-funnel Performance Max, this module helps you align product-level structure with business performance and strategic scaling.
Perfect for refining your product feed, campaign segmentation, and budget strategy—without guessing.
Other Master Dashboard Pages
Other Master Dashboard Pages
Check out all the pages included in the Master Bundle:
Check out all the pages included in the Master Bundle:
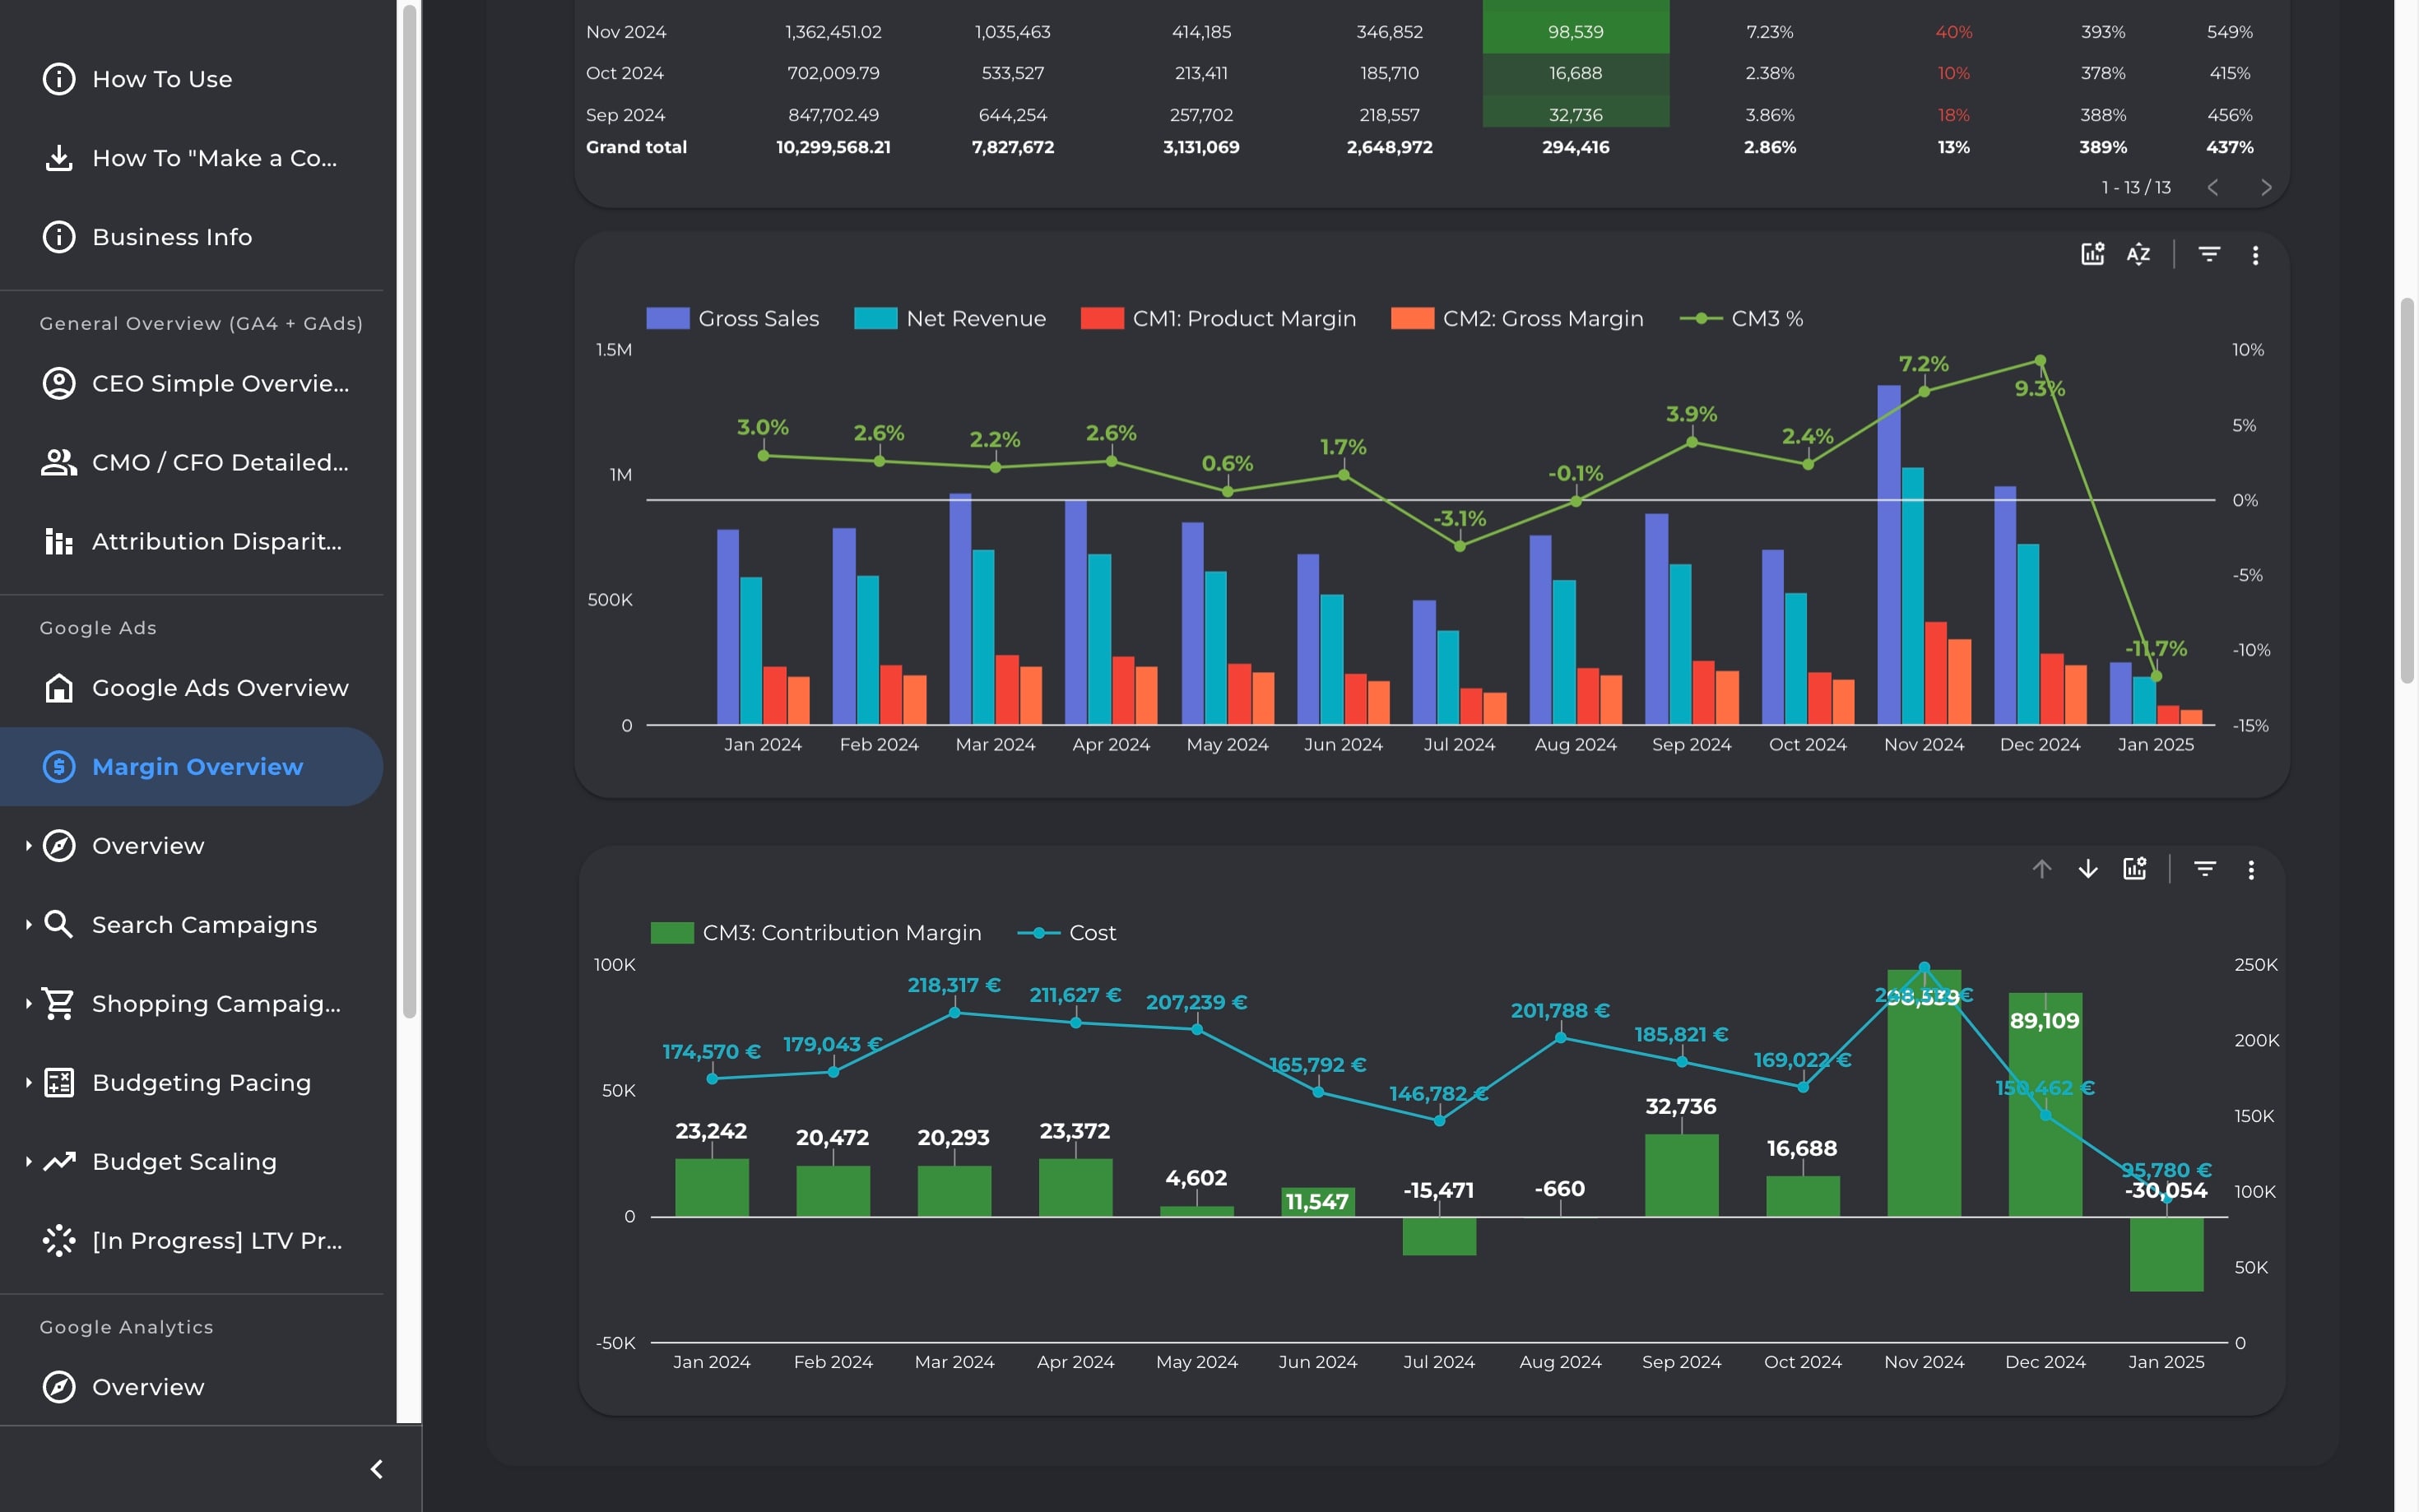
Visualize the full flow from sales to profit with a 3-tier margin breakdown. Estimate contribution margin and break-even ROAS to make smarter, finance-aligned marketing decisions.
Visualize the full flow from sales to profit with a 3-tier margin breakdown. Estimate contribution margin and break-even ROAS to make smarter, finance-aligned marketing decisions.
Visualize the full flow from sales to profit with a 3-tier margin breakdown. Estimate contribution margin and break-even ROAS to make smarter, finance-aligned marketing decisions.
Visualize the full flow from sales to profit with a 3-tier margin breakdown. Estimate contribution margin and break-even ROAS to make smarter, finance-aligned marketing decisions.
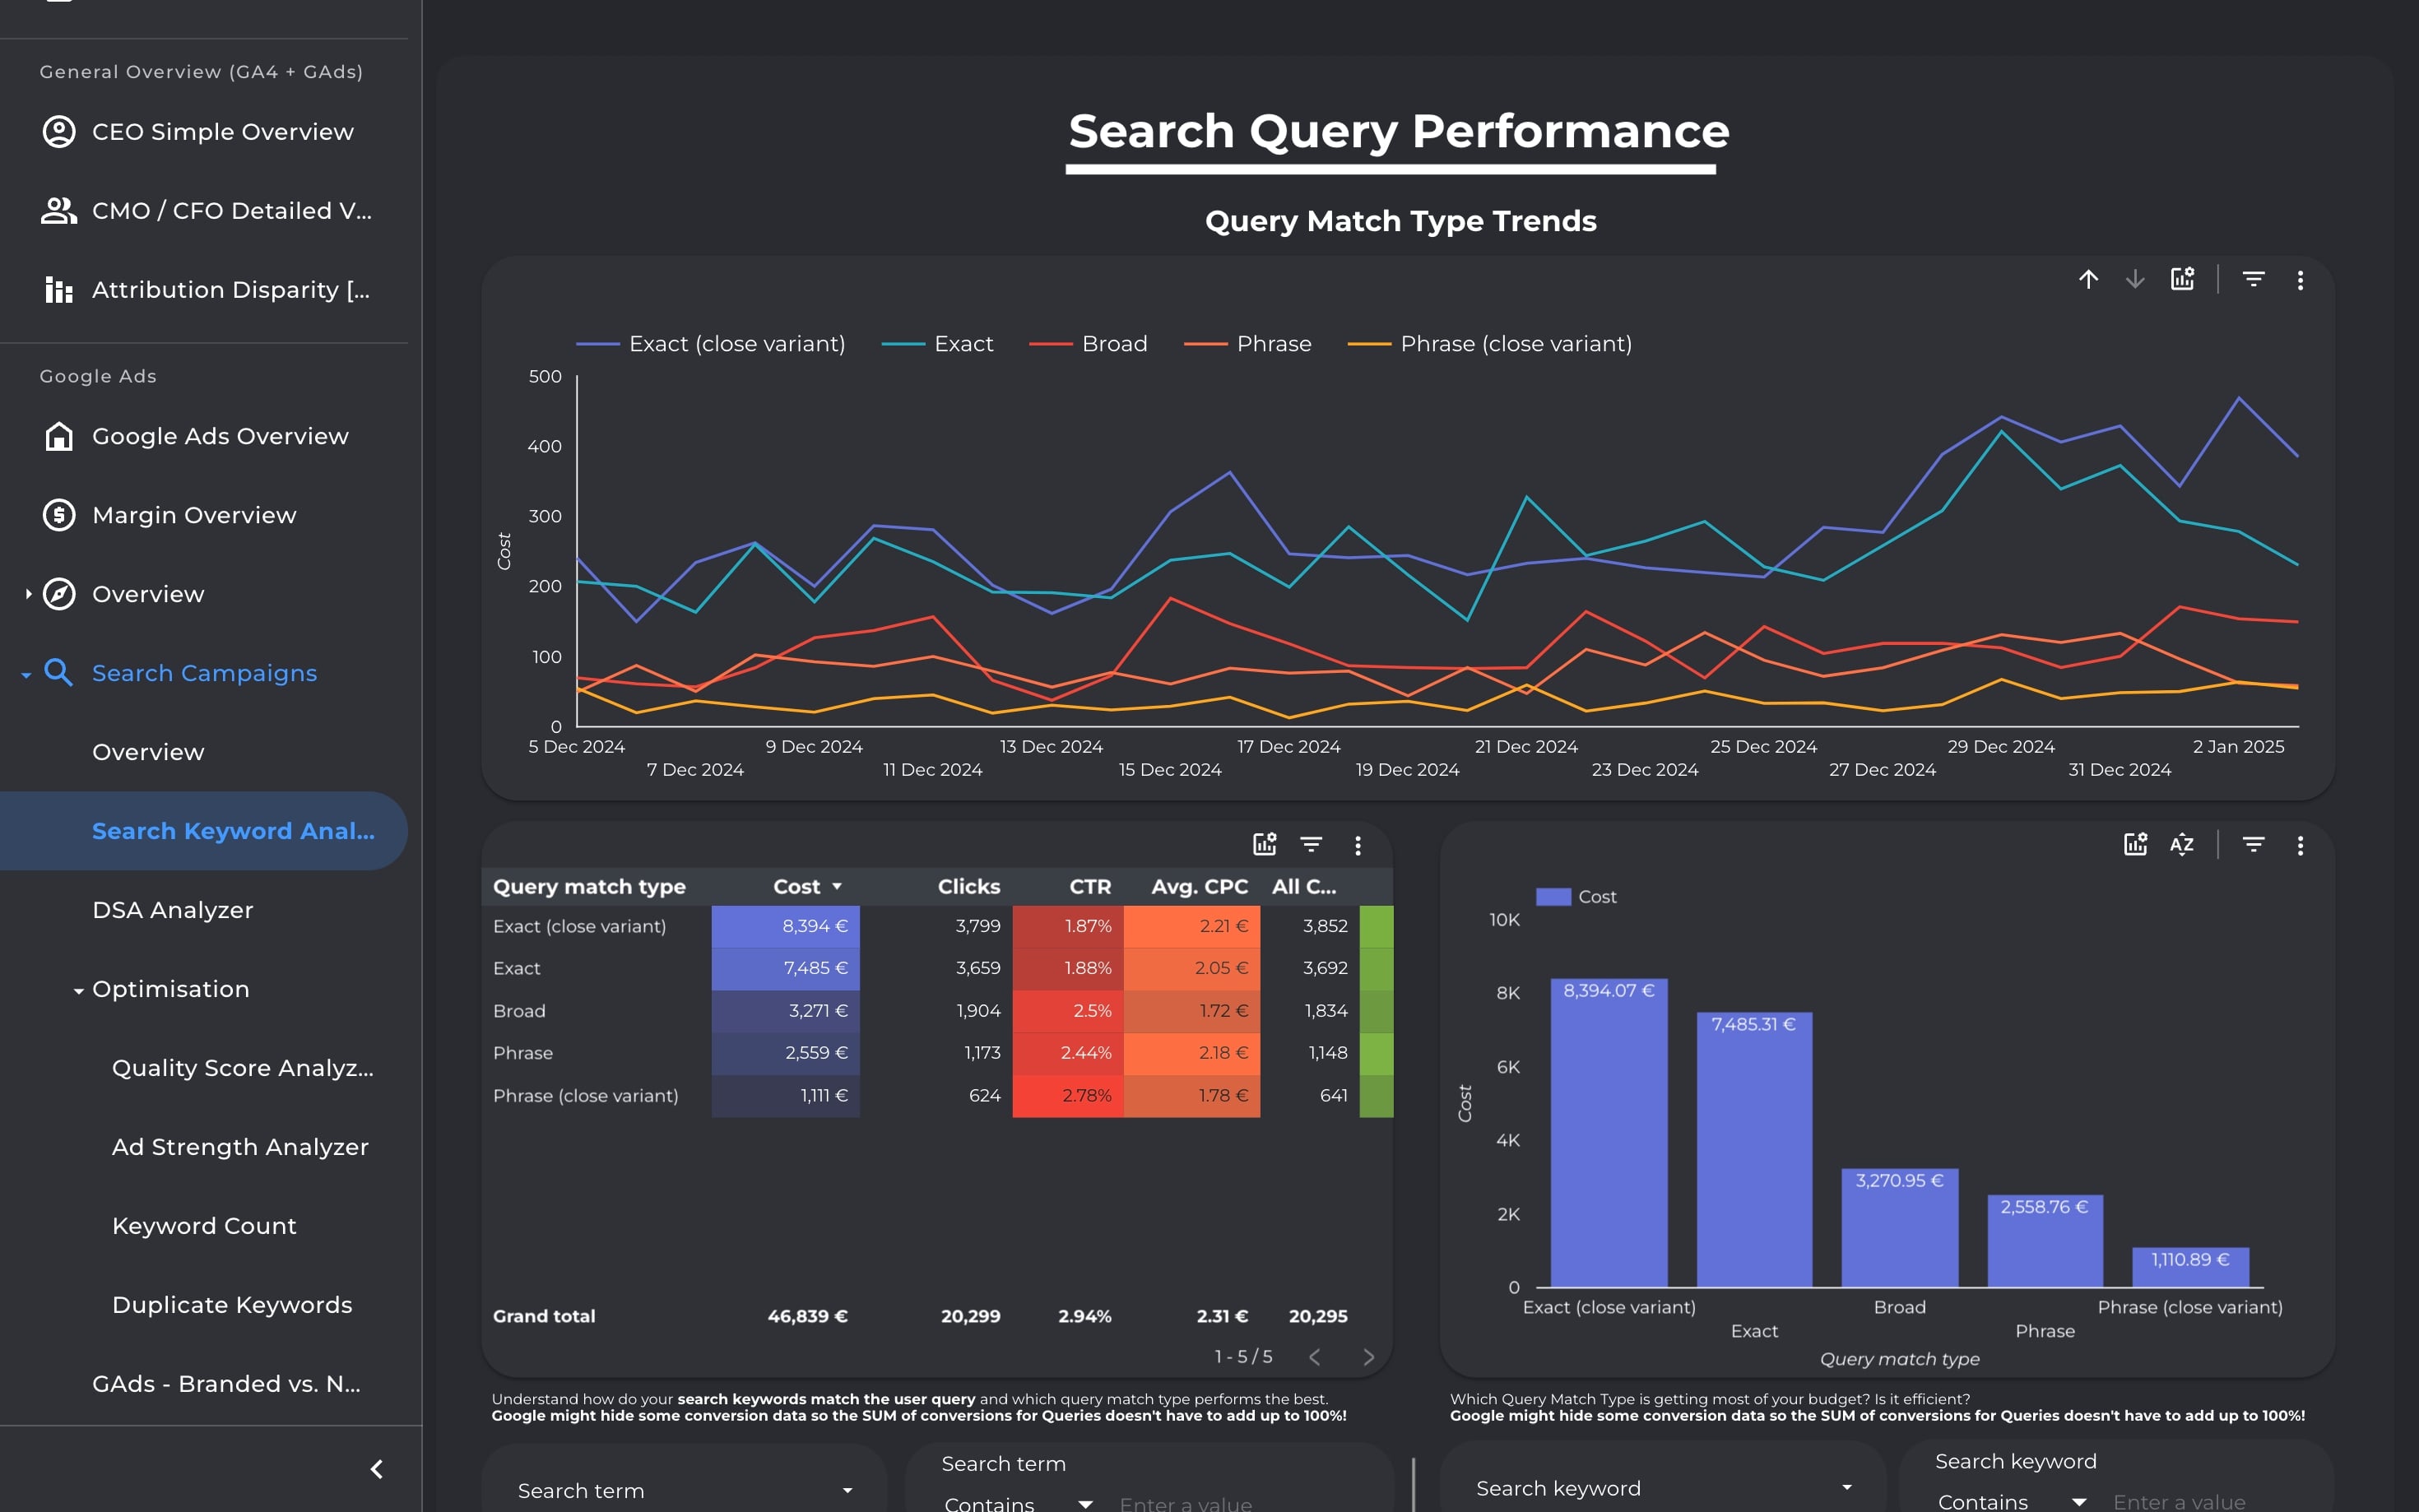
Diagnose and optimize your Search Ads campaigns from every angle—keywords, queries, match types, DSA, structure, and scoring. Identify waste, improve ROI, and simplify with data-backed decisions.
Diagnose and optimize your Search Ads campaigns from every angle—keywords, queries, match types, DSA, structure, and scoring. Identify waste, improve ROI, and simplify with data-backed decisions.
Diagnose and optimize your Search Ads campaigns from every angle—keywords, queries, match types, DSA, structure, and scoring. Identify waste, improve ROI, and simplify with data-backed decisions.
Diagnose and optimize your Search Ads campaigns from every angle—keywords, queries, match types, DSA, structure, and scoring. Identify waste, improve ROI, and simplify with data-backed decisions.

Analyze how performance changes with increased budget using regression analysis. Predict breakeven and find the sweet spot to scale or pause campaigns.
Analyze how performance changes with increased budget using regression analysis. Predict breakeven and find the sweet spot to scale or pause campaigns.
Analyze how performance changes with increased budget using regression analysis. Predict breakeven and find the sweet spot to scale or pause campaigns.
Analyze how performance changes with increased budget using regression analysis. Predict breakeven and find the sweet spot to scale or pause campaigns.