Google Ads Overview
Google Ads Overview
Google Ads Overview
Your daily Google Ads pulse check—spend, profit, and trends in one clear view.
Your daily Google Ads pulse check—spend, profit, and trends in one clear view.
Your daily Google Ads pulse check—spend, profit, and trends in one clear view.
Highlights:
Google Ads-only revenue and cost tracking
Net Contribution Margin calculation based on average gross margin
Daily breakdown of ROAS, CPA, CVR%, CPC, and AOV
Built-in PoP (Period-over-Period) and YoY (Year-over-Year) comparisons
Visualized performance across days and weekdays
Auto-detection of spikes or dips in efficiency and return
Aggregated and granular profit analysis
Ideal for spotting trends, waste, and optimization opportunities
Cross-filtered graph + data table for both strategy and ops teams
The Google Ads Overview (Google-only version) gives you a laser-focused lens into how your ad spend on Google is performing—without the noise of other channels.
This page shows a daily breakdown of:
Ad Spend
Revenue (Google-attributed)
ROAS
Net Contribution Margin (based on average gross margin)
CPC, CPA, CVR%, and AOV
What makes it powerful is the blend of daily granularity and strategic summary:
You’ll spot which weekdays are consistently inefficient.
You can track how performance evolves week-over-week or month-over-month.
Built-in PoP and YoY comparisons help you contextualize growth or decline.
The heat-mapped data table shows high and low performers at a glance, while the graph plots spend and margin trends together—so you always understand if your revenue is profitable.
Whether you’re checking in daily or doing a weekly wrap-up, this view is essential for keeping spend aligned with margin targets.
Ideal for solo marketers, agencies, and eCommerce managers who need a fast, reliable overview of Google Ads ROI—without second-guessing the data.
Other Master Dashboard Pages
Other Master Dashboard Pages
Check out all the pages included in the Master Bundle:
Check out all the pages included in the Master Bundle:
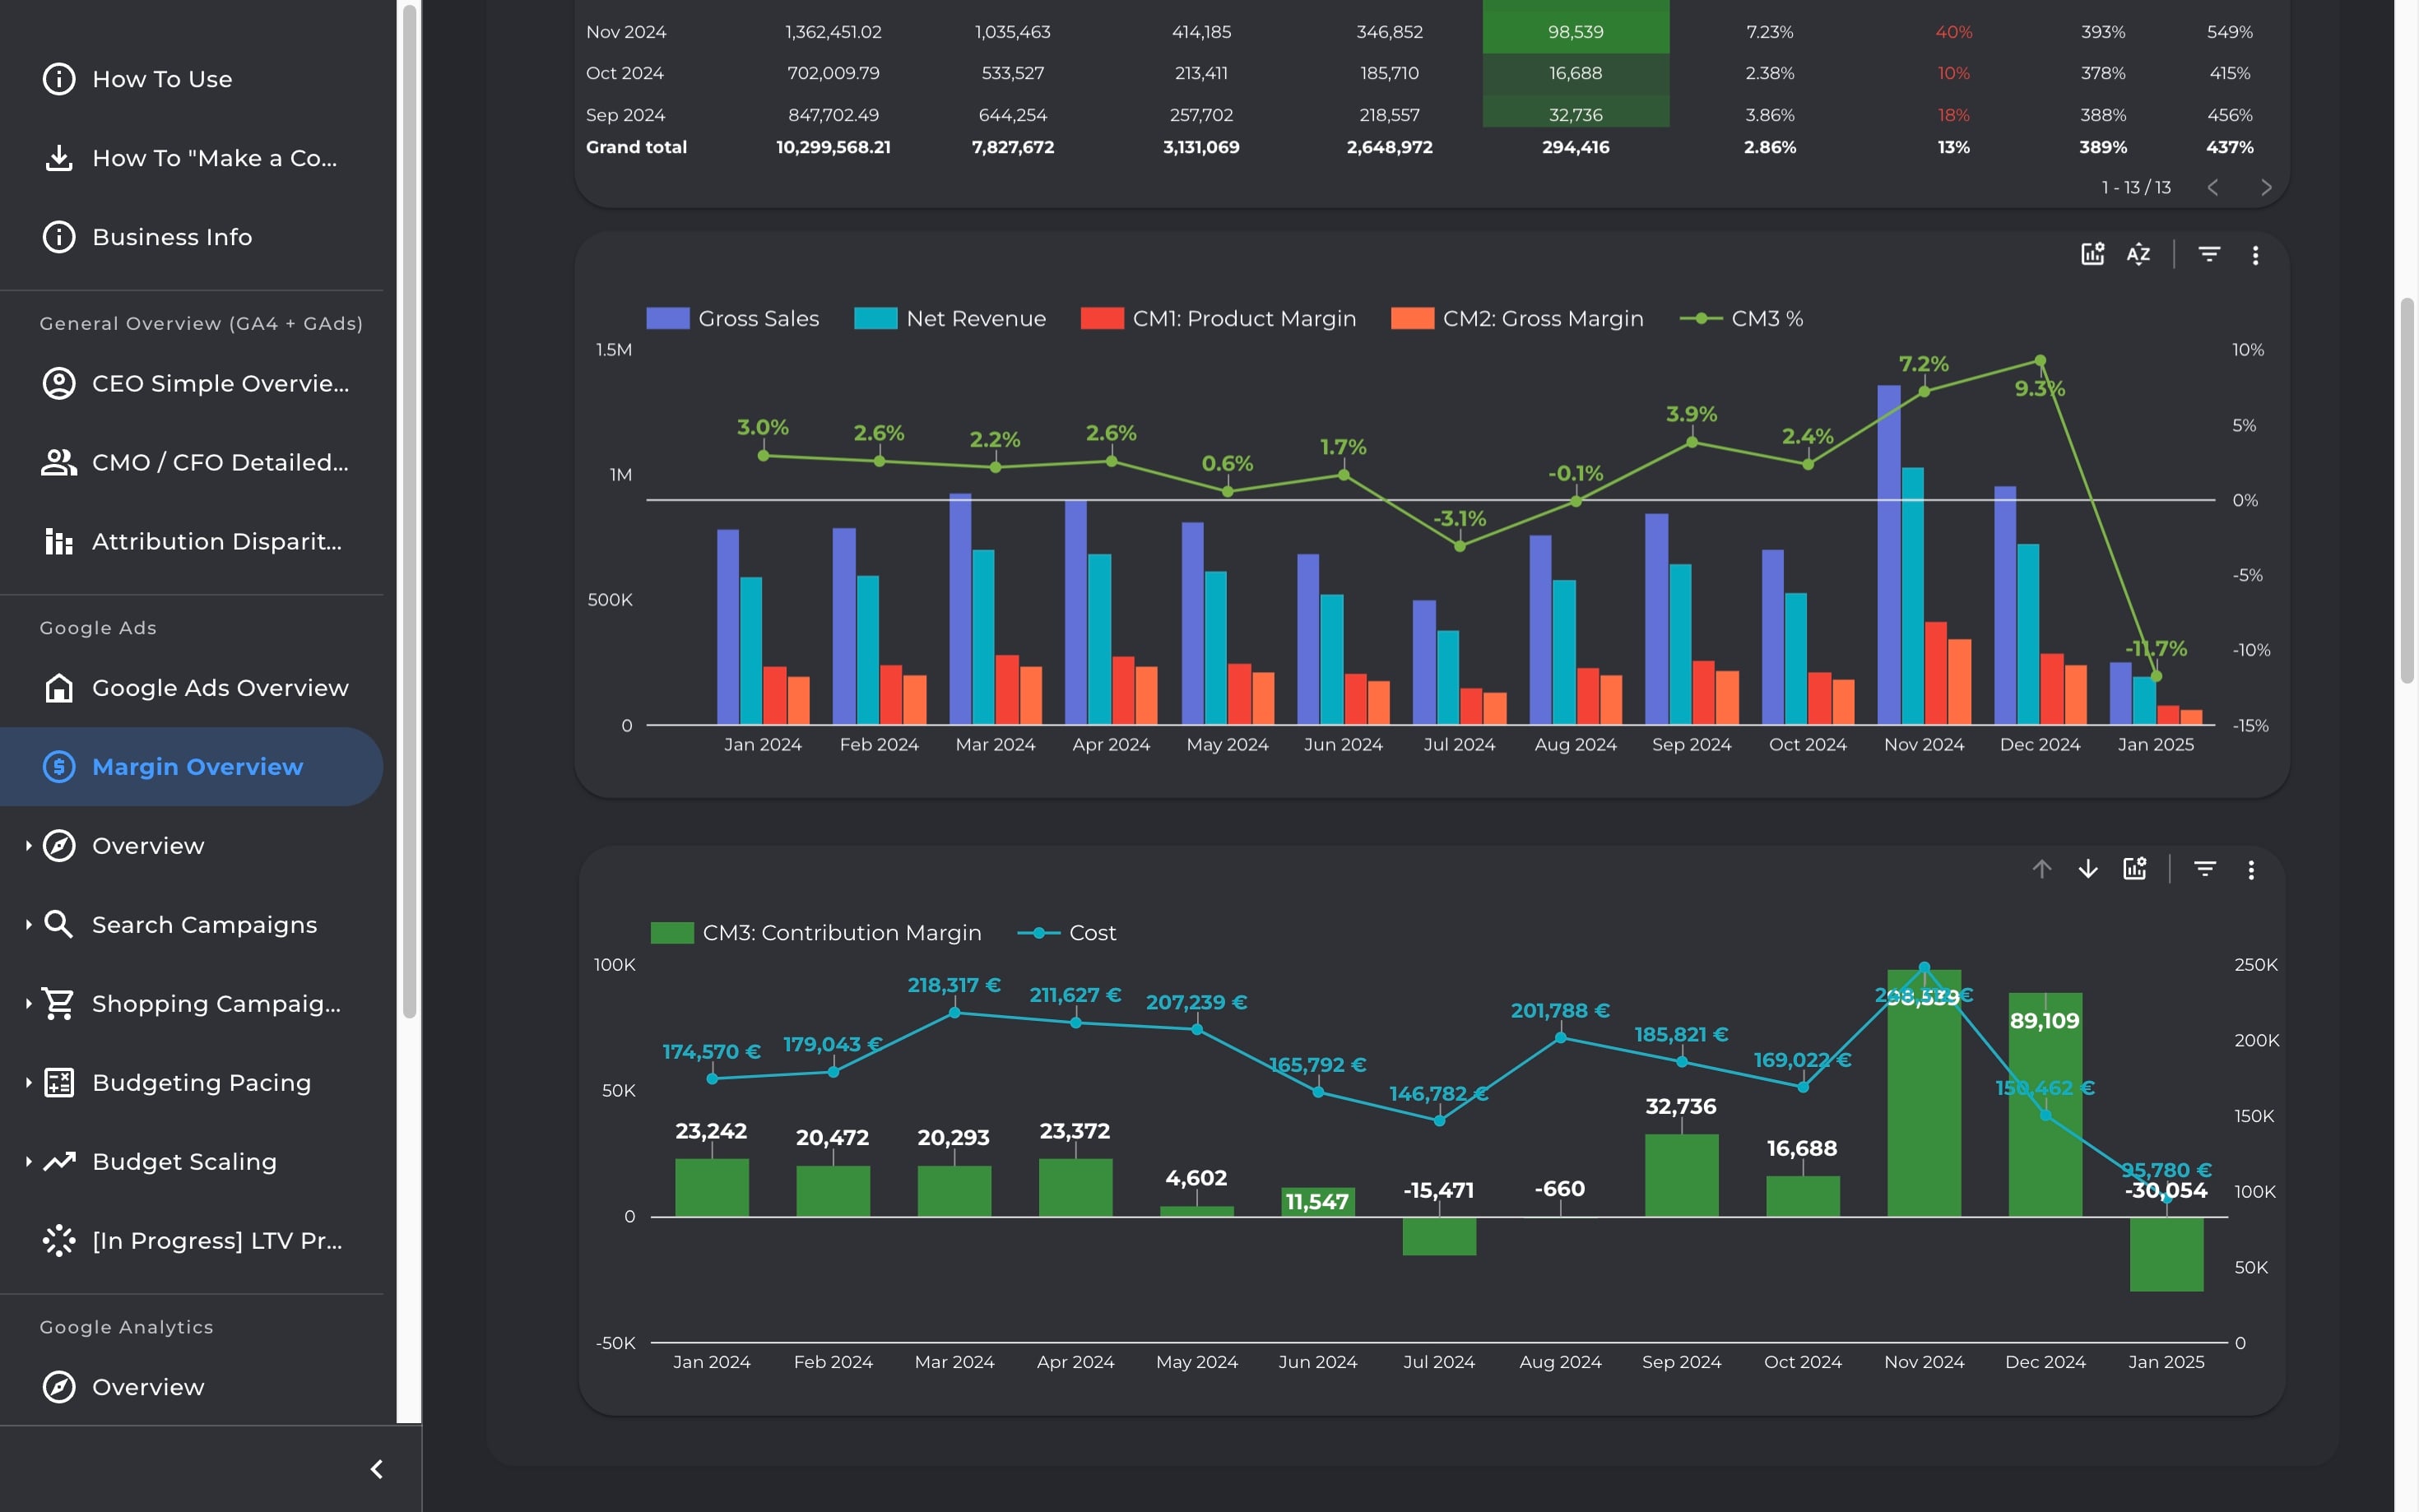
Visualize the full flow from sales to profit with a 3-tier margin breakdown. Estimate contribution margin and break-even ROAS to make smarter, finance-aligned marketing decisions.
Visualize the full flow from sales to profit with a 3-tier margin breakdown. Estimate contribution margin and break-even ROAS to make smarter, finance-aligned marketing decisions.
Visualize the full flow from sales to profit with a 3-tier margin breakdown. Estimate contribution margin and break-even ROAS to make smarter, finance-aligned marketing decisions.
Visualize the full flow from sales to profit with a 3-tier margin breakdown. Estimate contribution margin and break-even ROAS to make smarter, finance-aligned marketing decisions.
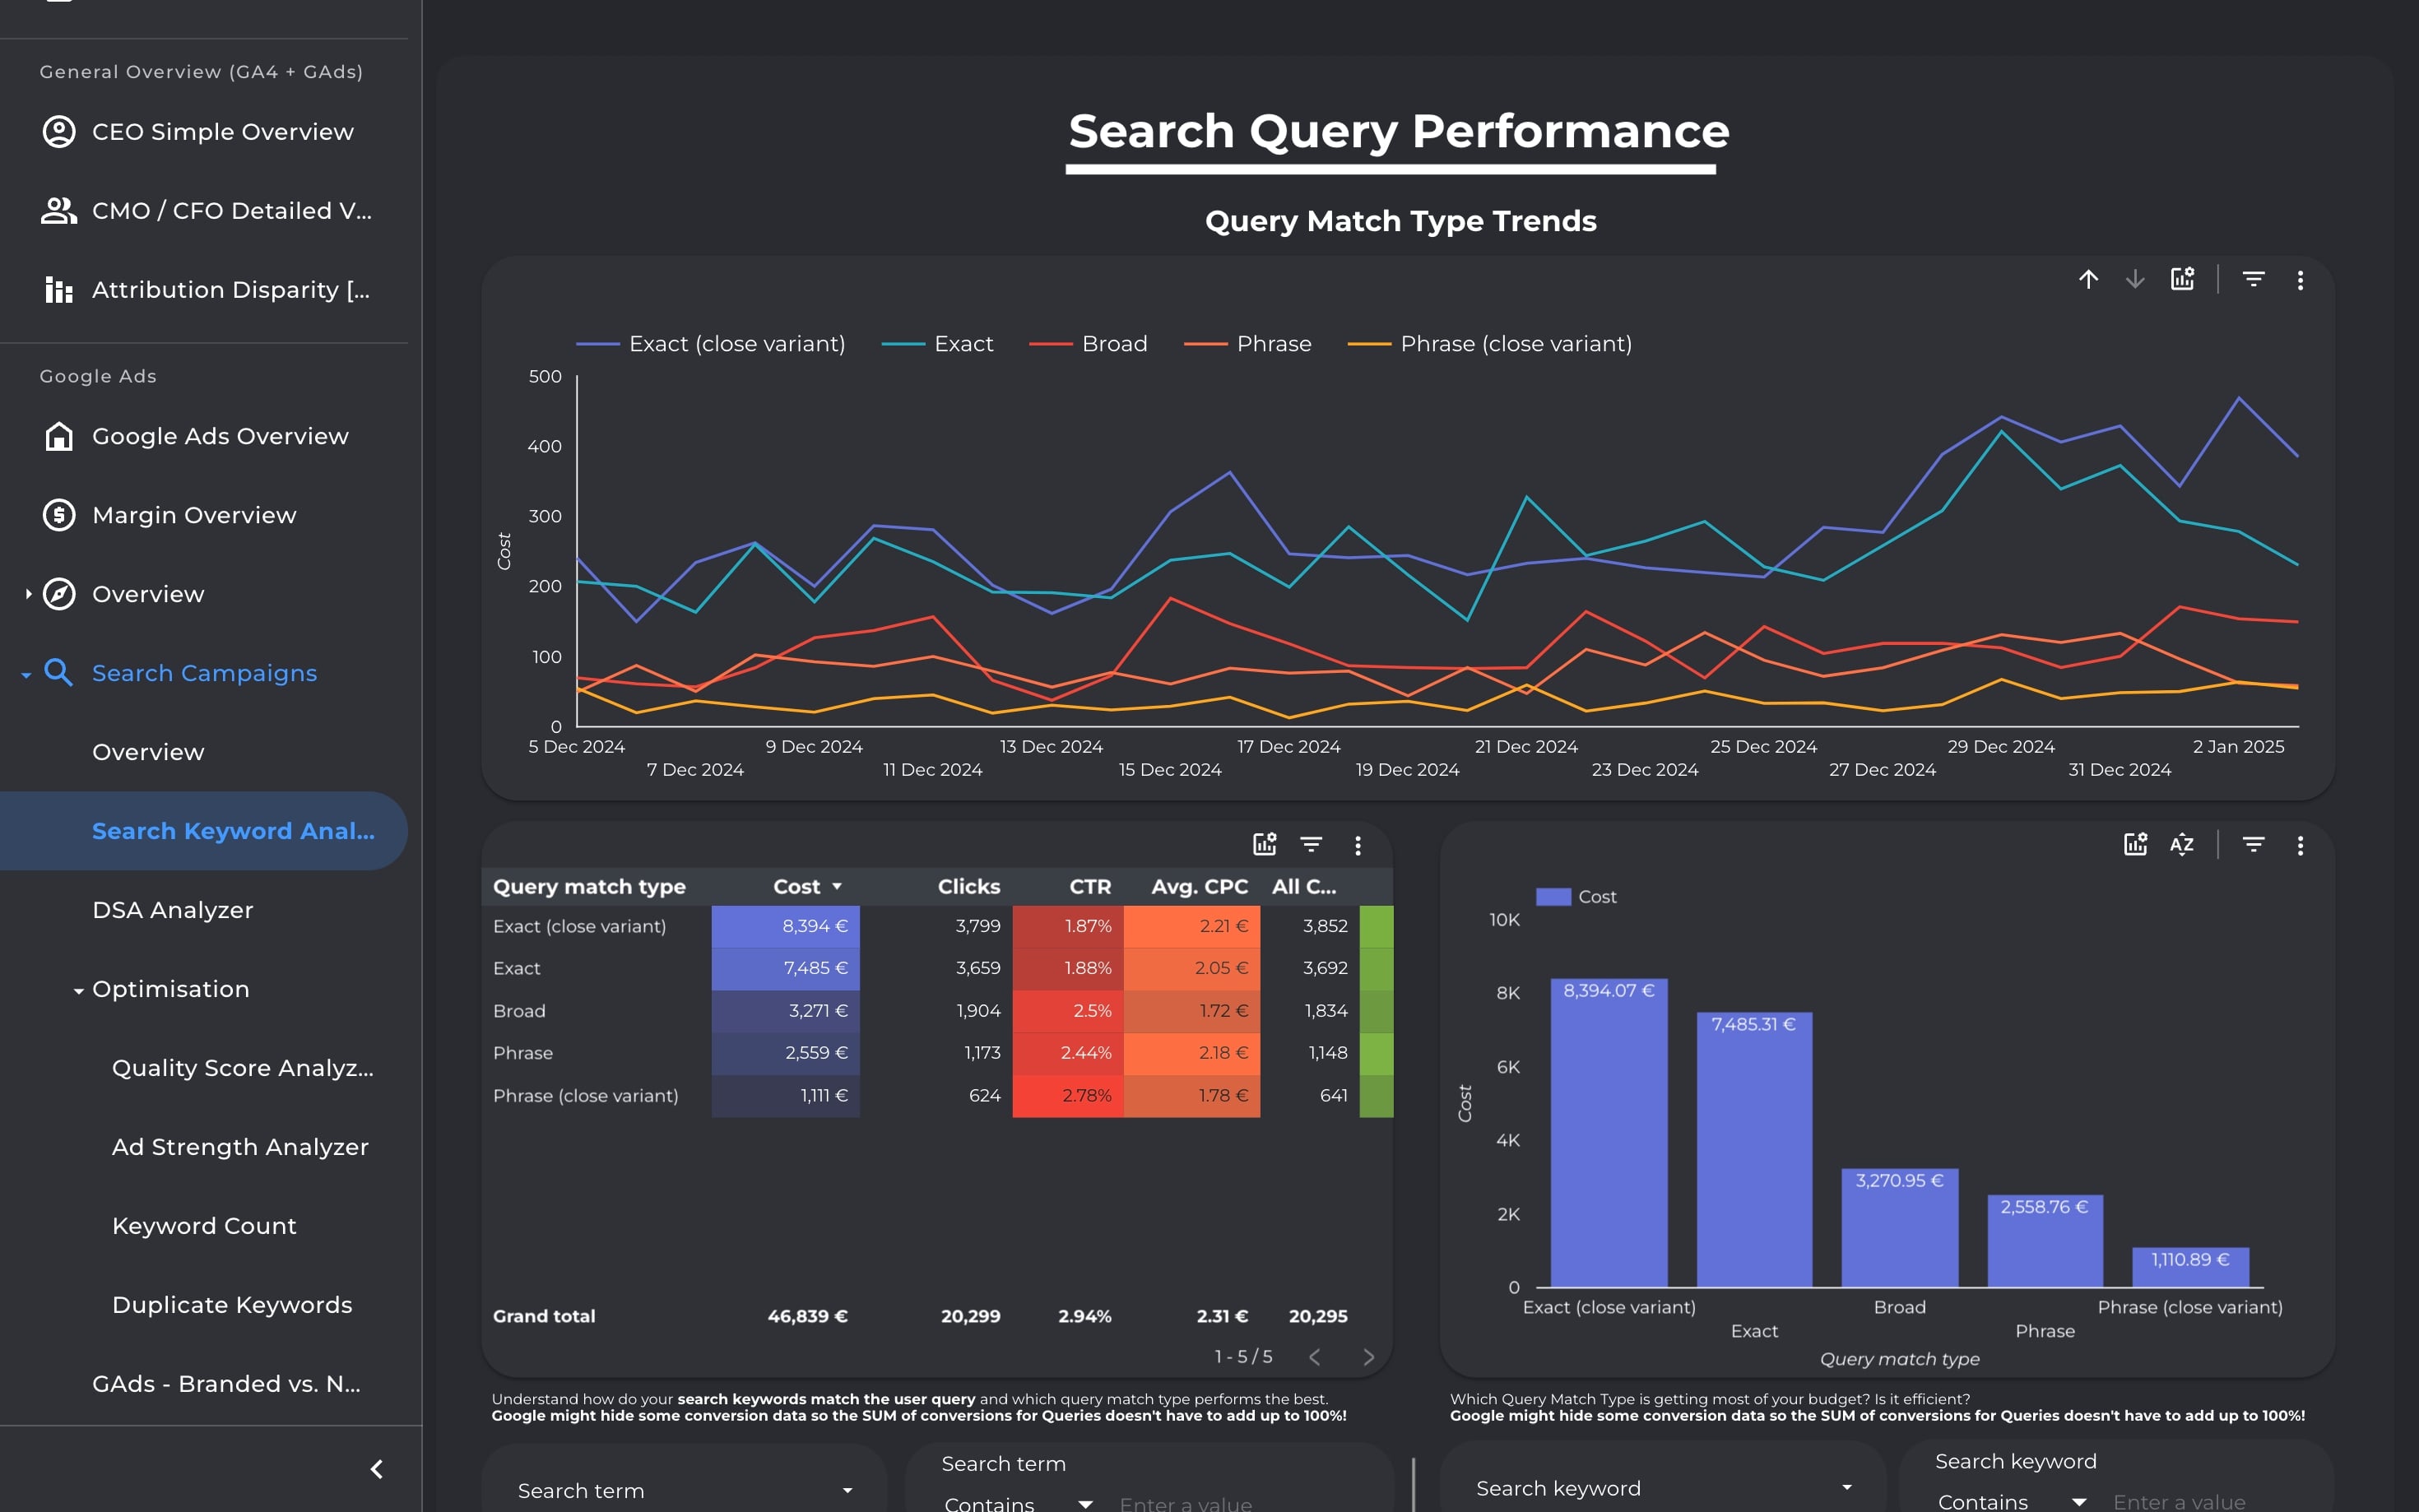
Diagnose and optimize your Search Ads campaigns from every angle—keywords, queries, match types, DSA, structure, and scoring. Identify waste, improve ROI, and simplify with data-backed decisions.
Diagnose and optimize your Search Ads campaigns from every angle—keywords, queries, match types, DSA, structure, and scoring. Identify waste, improve ROI, and simplify with data-backed decisions.
Diagnose and optimize your Search Ads campaigns from every angle—keywords, queries, match types, DSA, structure, and scoring. Identify waste, improve ROI, and simplify with data-backed decisions.
Diagnose and optimize your Search Ads campaigns from every angle—keywords, queries, match types, DSA, structure, and scoring. Identify waste, improve ROI, and simplify with data-backed decisions.
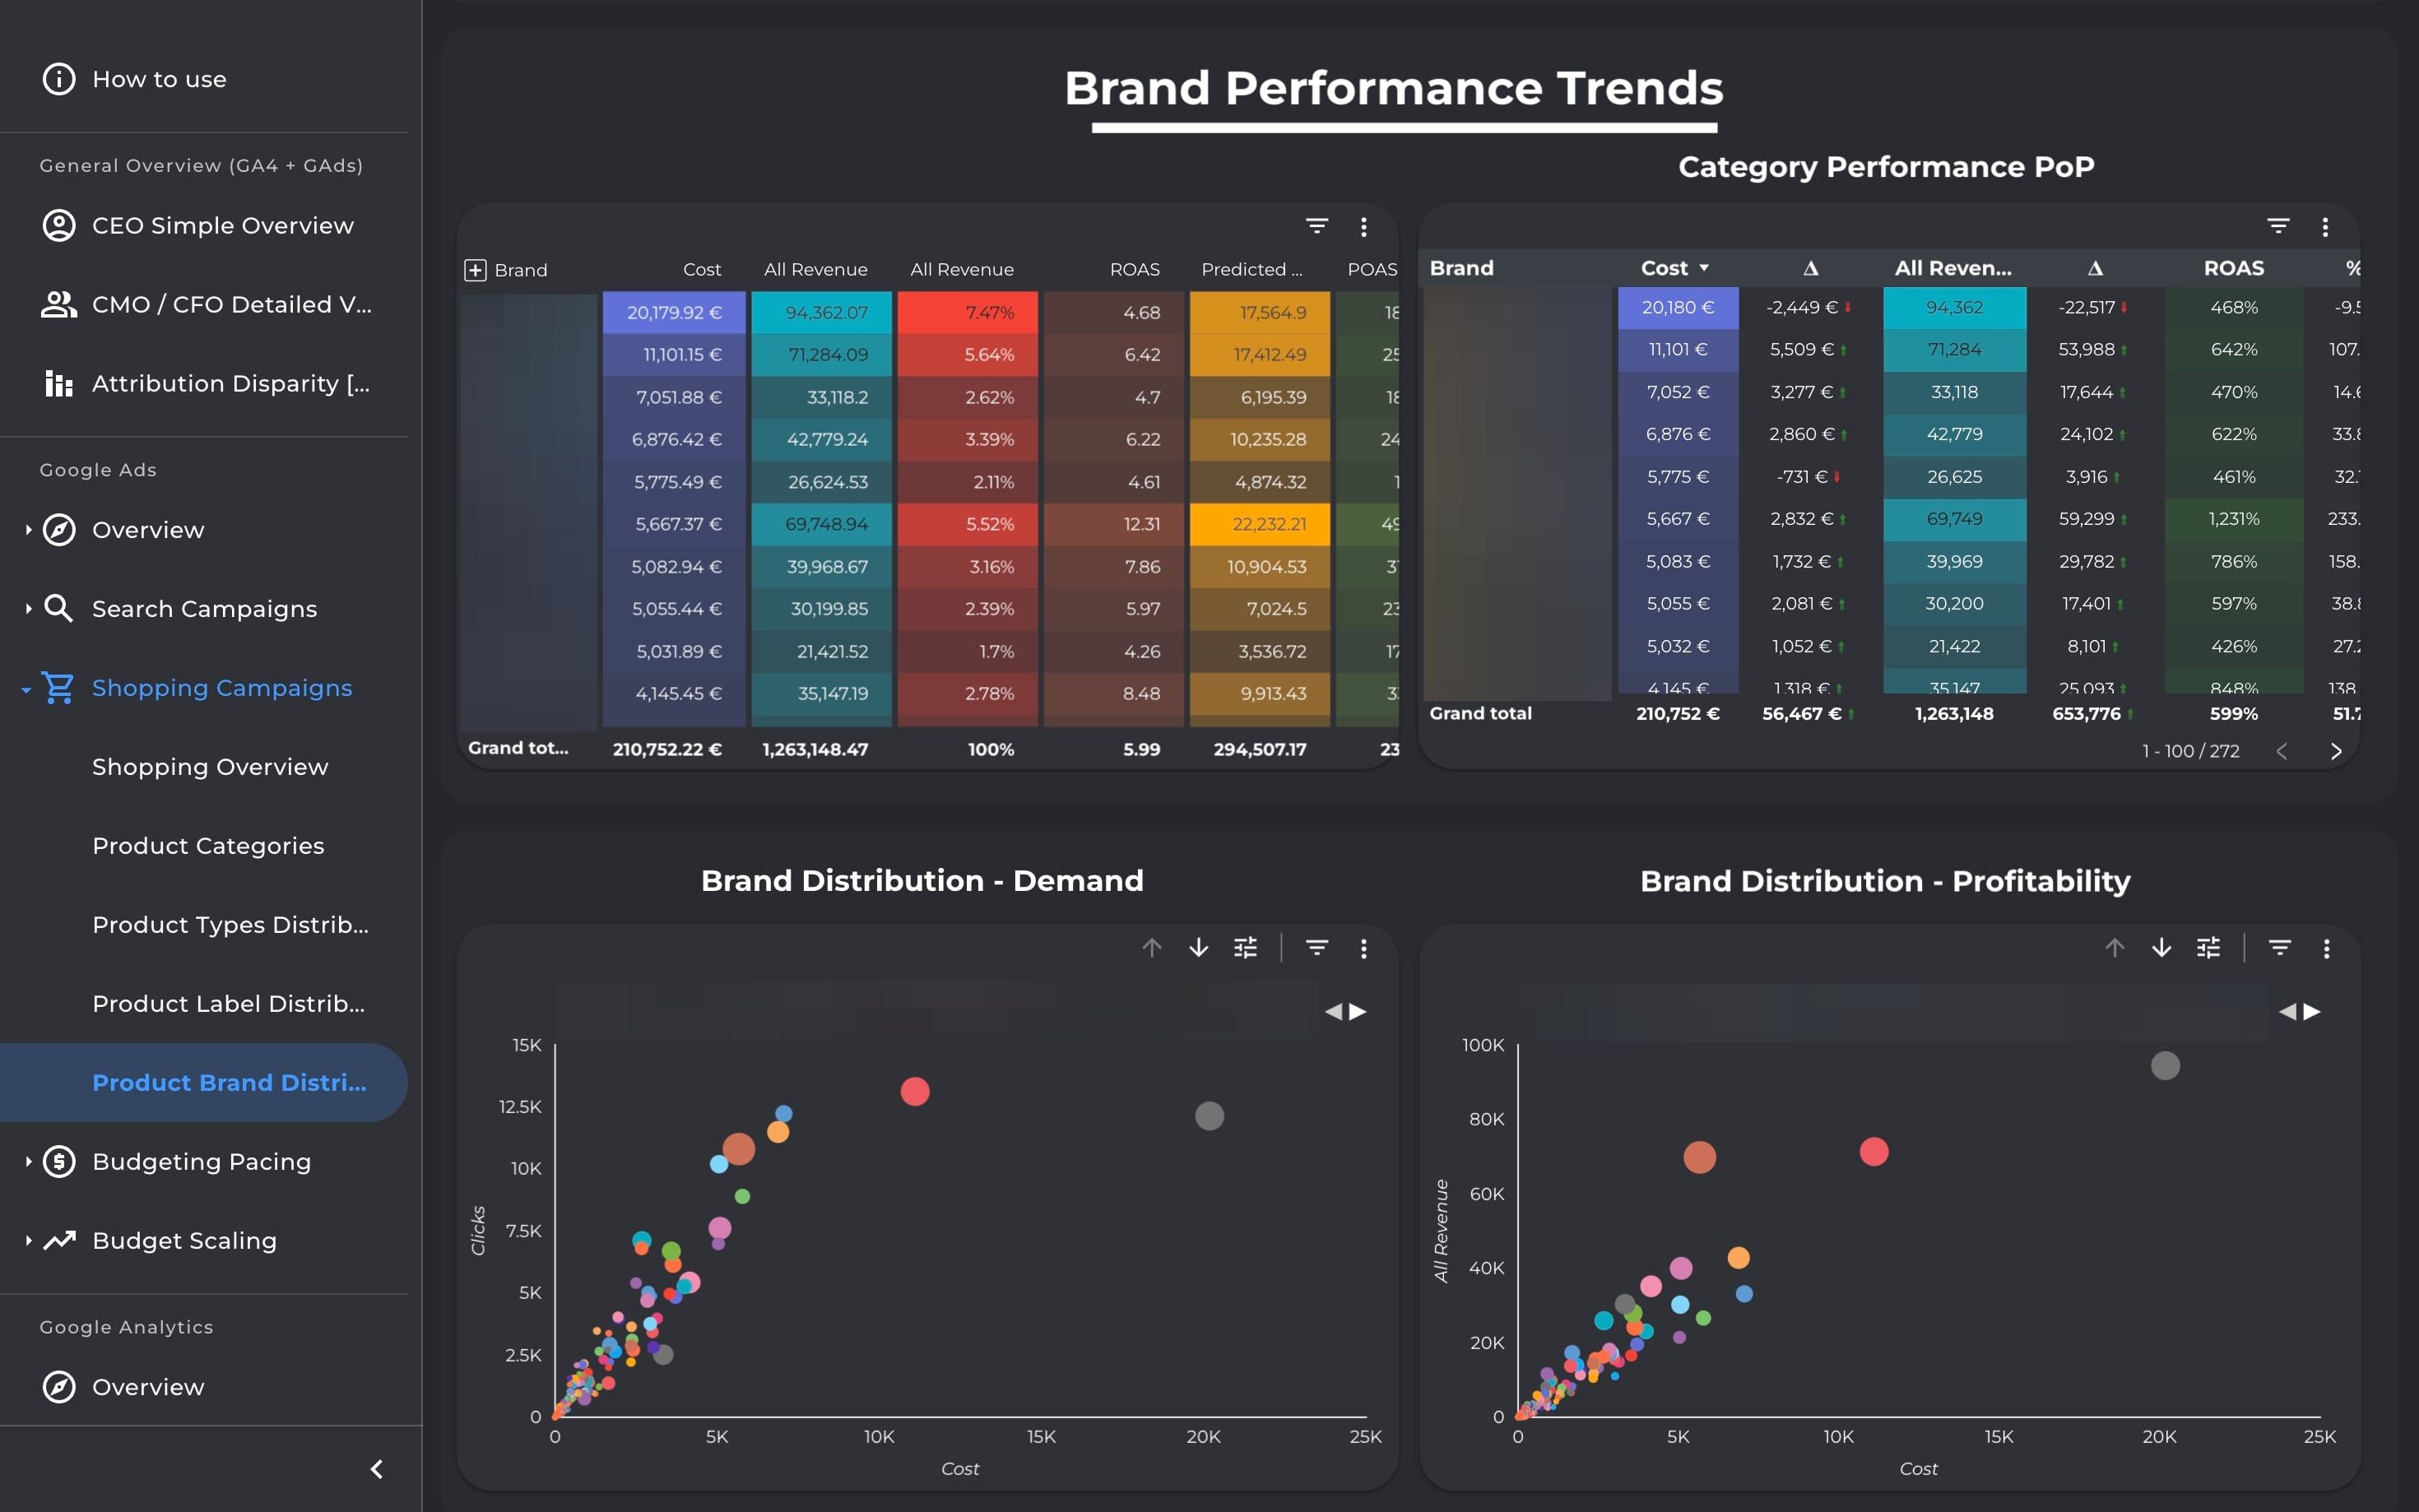
Analyze Shopping & PMax campaign profitability at product level. Drill into categories, brands, and labels to surface bestsellers, optimize structures, and align spend with scalable, high-margin products.
Analyze Shopping & PMax campaign profitability at product level. Drill into categories, brands, and labels to surface bestsellers, optimize structures, and align spend with scalable, high-margin products.
Analyze Shopping & PMax campaign profitability at product level. Drill into categories, brands, and labels to surface bestsellers, optimize structures, and align spend with scalable, high-margin products.
Analyze Shopping & PMax campaign profitability at product level. Drill into categories, brands, and labels to surface bestsellers, optimize structures, and align spend with scalable, high-margin products.