Attribution Disparity – GA4 vs Google Ads Revenue
Attribution Disparity – GA4 vs Google Ads Revenue
Attribution Disparity – GA4 vs Google Ads Revenue
See how much revenue Google Ads is claiming — and how much GA4 actually tracks.
See how much revenue Google Ads is claiming — and how much GA4 actually tracks.
See how much revenue Google Ads is claiming — and how much GA4 actually tracks.
Highlights:
Tracks GA4 revenue (filtered for Google CPC) vs. Google Ads-reported revenue
Shows GA4-to-GAds revenue ratio over time
Highlights disparity percentage to benchmark attribution differences
Quickly detect if Google Ads is over-attributing performance
Aligns reporting between marketing and finance teams
Helps assess true incrementality of ad spend
Includes eCommerce summary for cost, GA4 ROAS, and GAds ROAS
Clear visual trend lines with day-level granularity
Explanatory notes clarify normal vs. concerning gaps
Actionable PoP and YoY variance indicators
The Attribution Disparity page helps you see through the fog of marketing attribution.
This report compares Google Ads-reported revenue with Google Analytics 4 revenue, specifically filtered for “google / cpc”.
The results are often striking: in many accounts, GA4 shows only one-third of what Google Ads claims.
That’s not necessarily a mistake — it’s just how attribution models differ.
Google Ads uses last non-direct click (and often inflates via data-driven attribution), while GA4 tends to be pessimistic, especially when using stricter first-party tracking setups.
The dashboard includes:
The GA4-to-GAds Revenue Ratio (in %)
The GA4 vs GAds Disparity (in % difference)
Visual trend graphs for both revenue sources
Commentary on normal thresholds and what deviations might mean
This is not just a reporting discrepancy—it’s a strategic signal. If GA4 attributes significantly less revenue to your ads, you should ask:
Are we cannibalizing organic or direct traffic?
Would these users convert without ads?
How much is truly incremental?
This module is especially useful for:
CMOs optimizing budgets
CFOs validating media spend
Marketers making a case for (or against) scaling
Use this report to defend budget decisions, uncover attribution inflation, and align internal teams on what “success” really means.
Other Master Dashboard Pages
Other Master Dashboard Pages
Check out all the pages included in the Master Bundle:
Check out all the pages included in the Master Bundle:
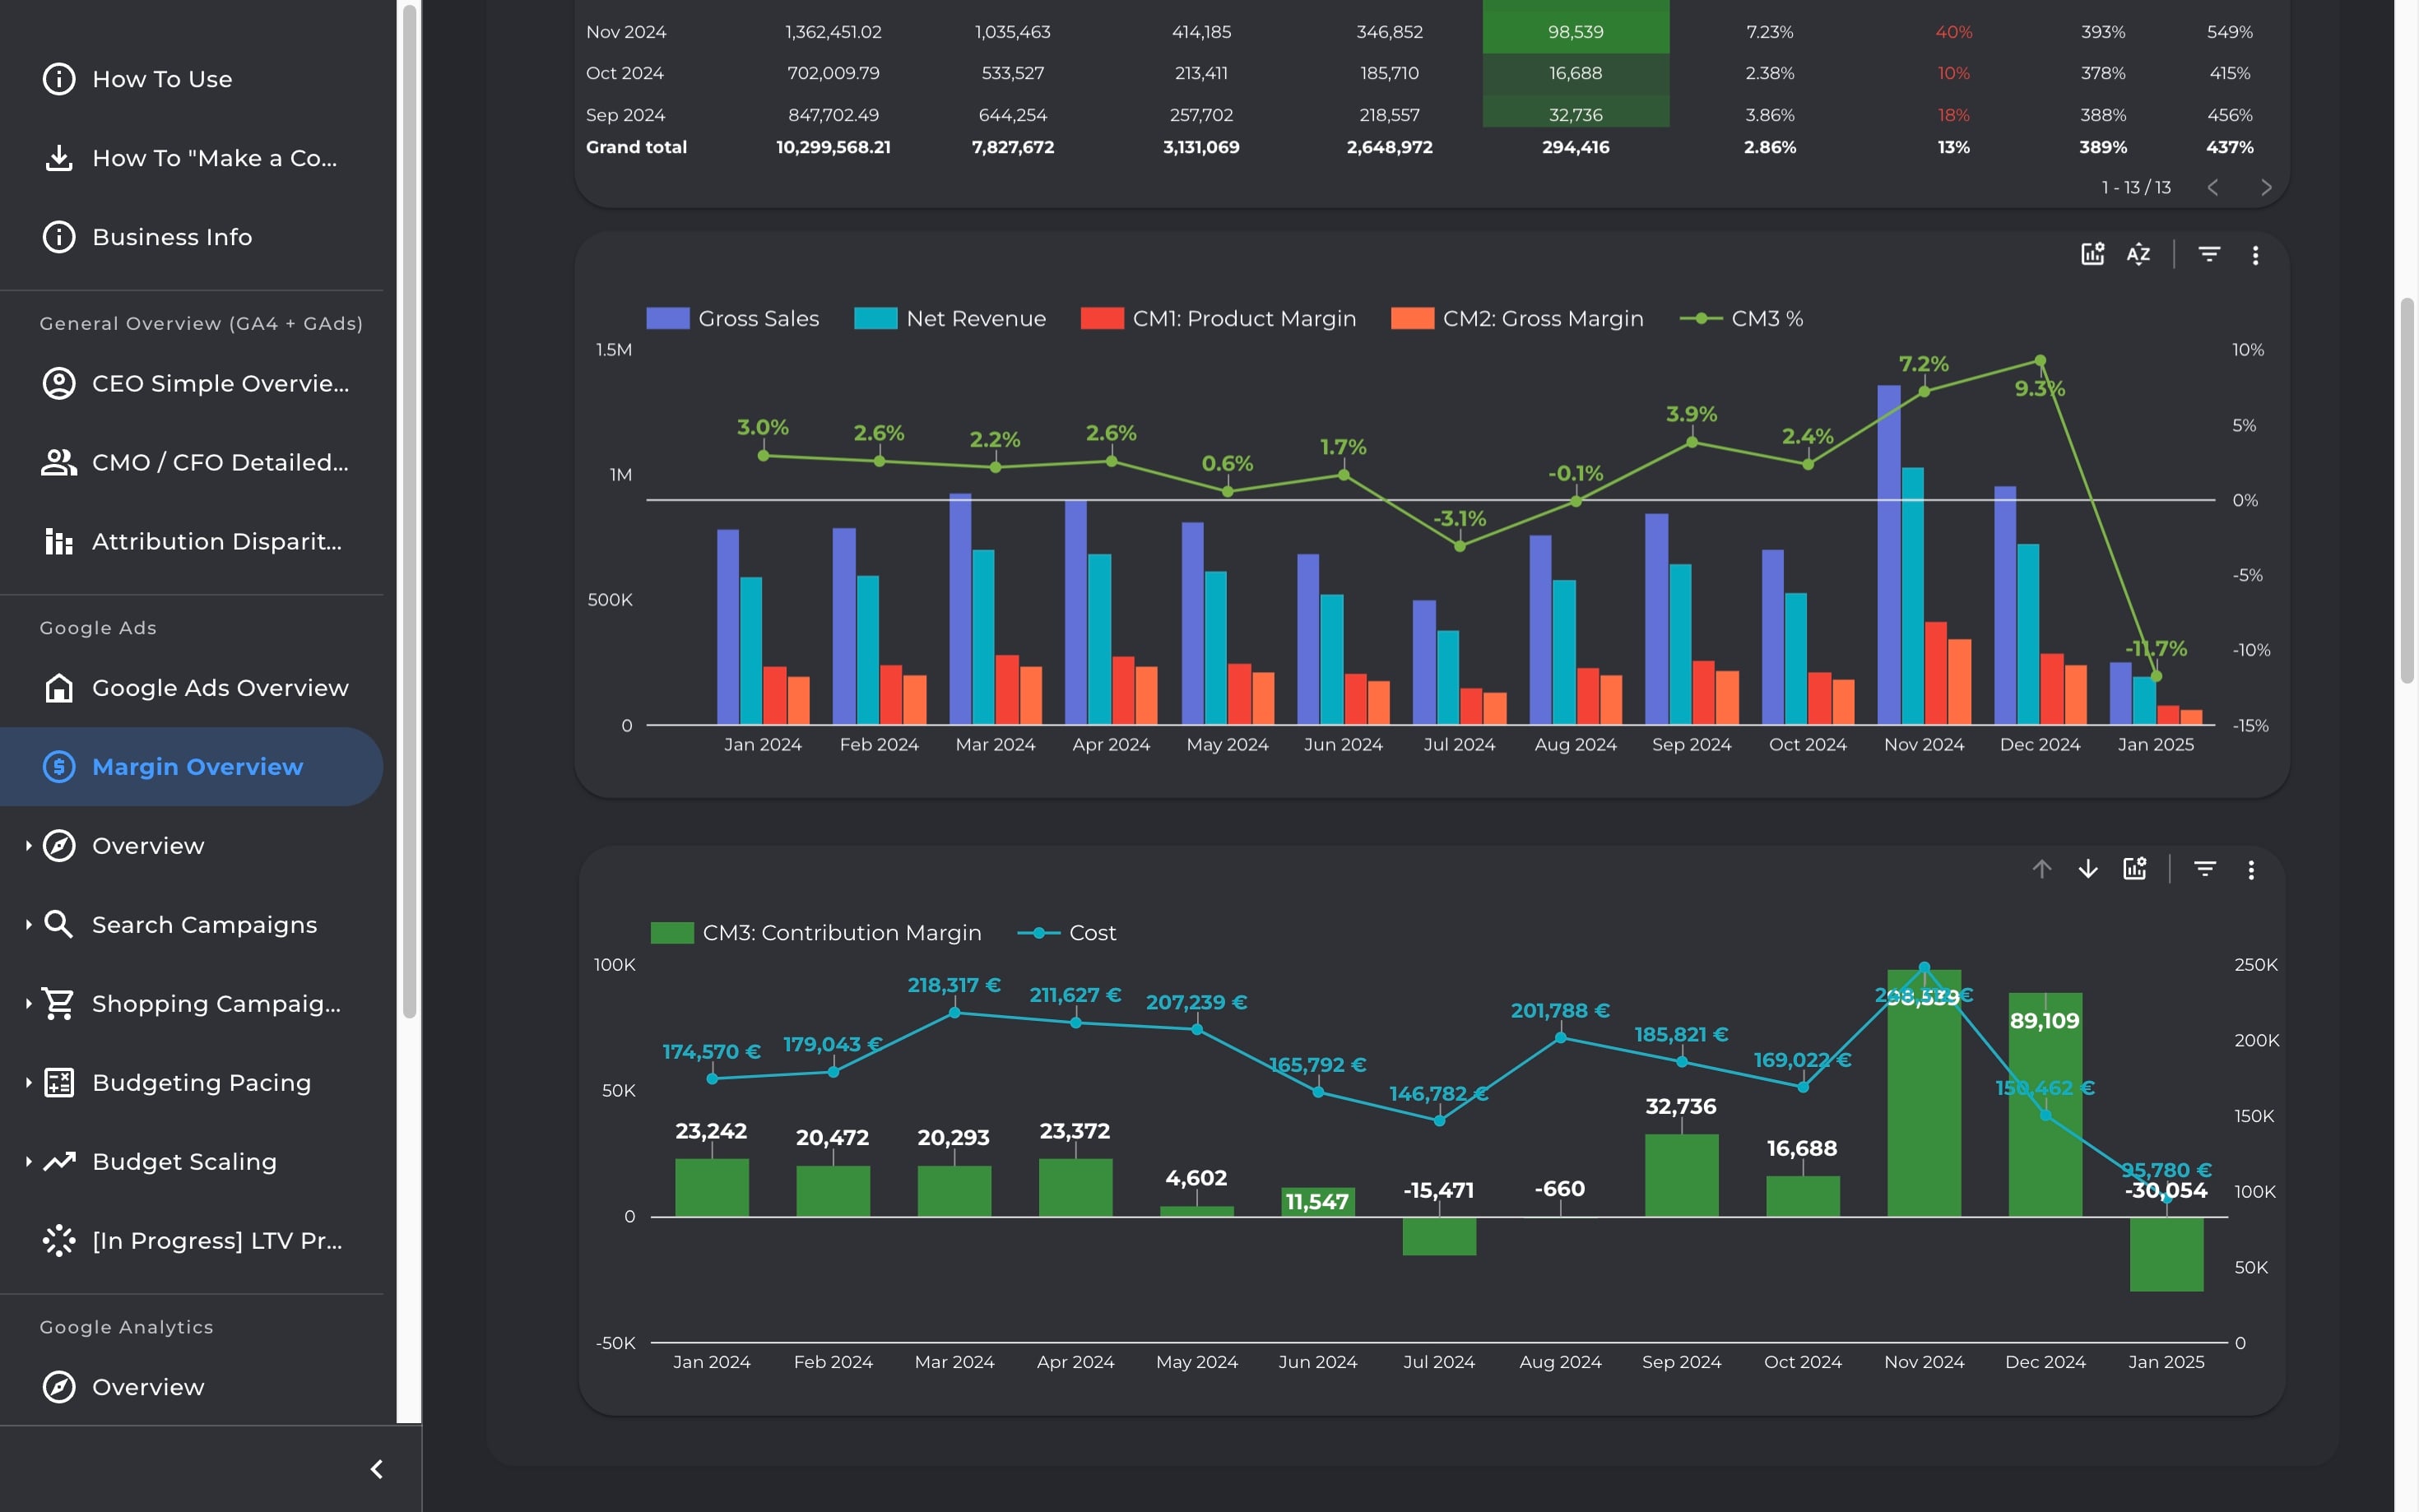
Visualize the full flow from sales to profit with a 3-tier margin breakdown. Estimate contribution margin and break-even ROAS to make smarter, finance-aligned marketing decisions.
Visualize the full flow from sales to profit with a 3-tier margin breakdown. Estimate contribution margin and break-even ROAS to make smarter, finance-aligned marketing decisions.
Visualize the full flow from sales to profit with a 3-tier margin breakdown. Estimate contribution margin and break-even ROAS to make smarter, finance-aligned marketing decisions.
Visualize the full flow from sales to profit with a 3-tier margin breakdown. Estimate contribution margin and break-even ROAS to make smarter, finance-aligned marketing decisions.
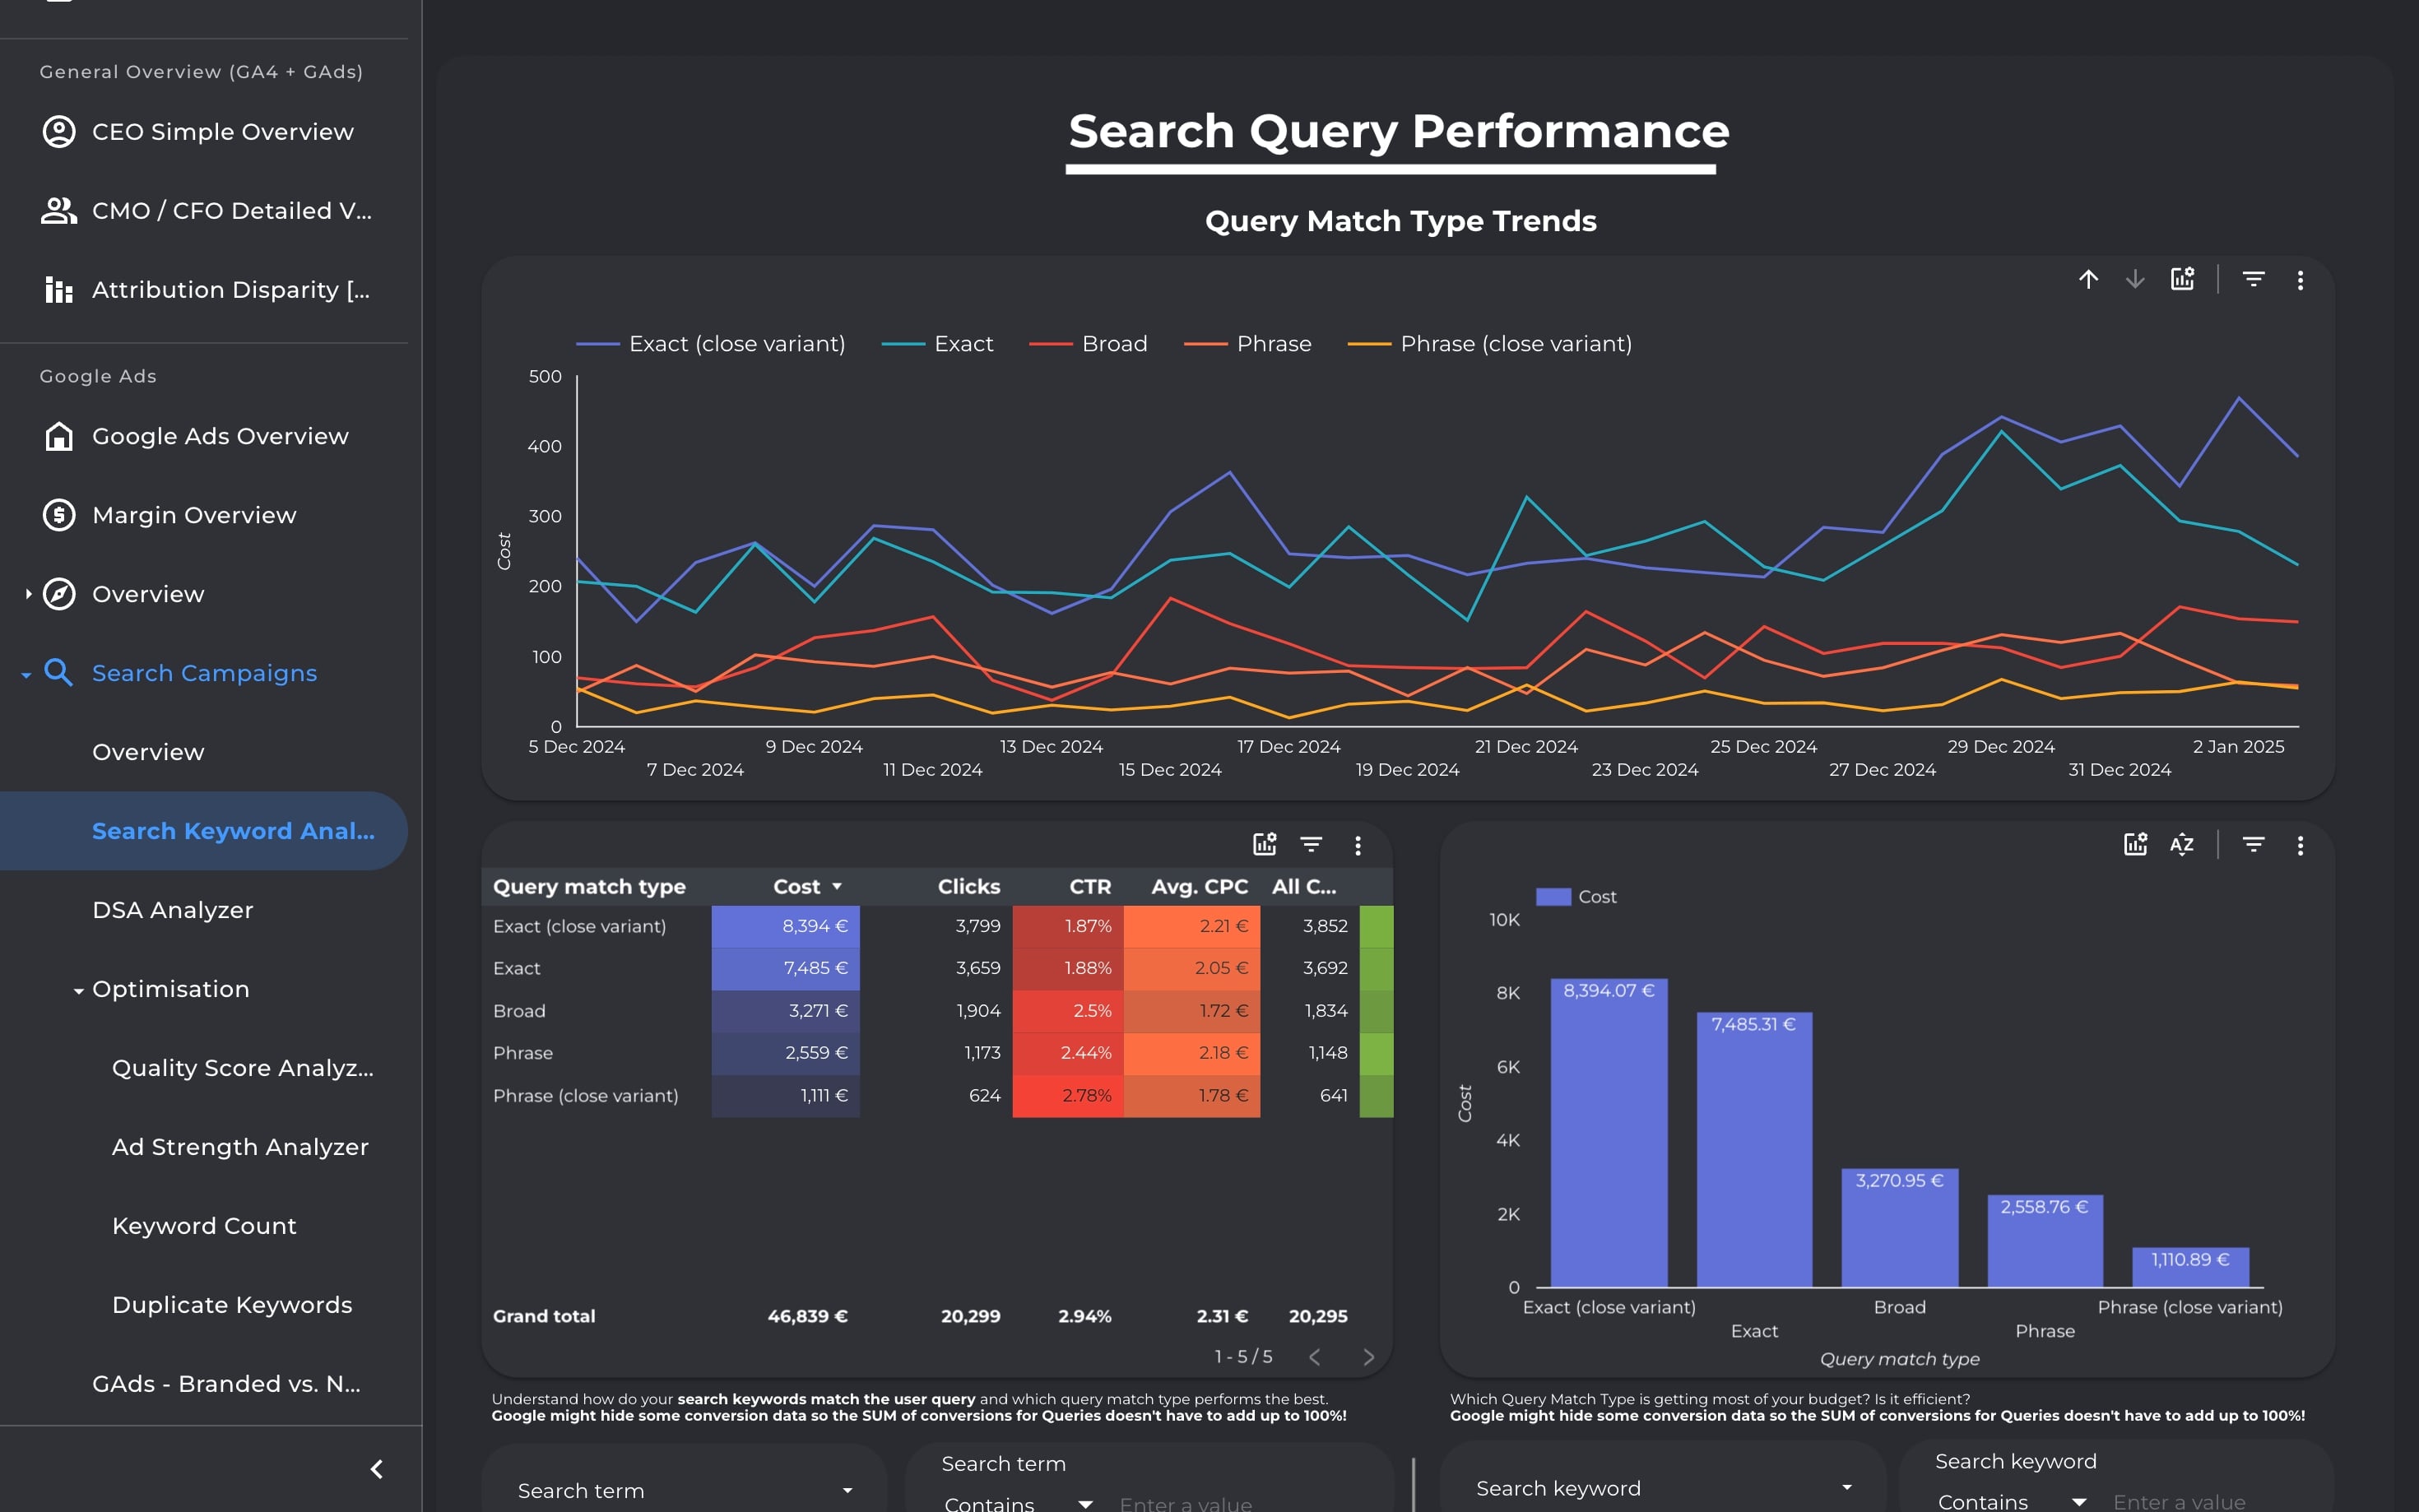
Diagnose and optimize your Search Ads campaigns from every angle—keywords, queries, match types, DSA, structure, and scoring. Identify waste, improve ROI, and simplify with data-backed decisions.
Diagnose and optimize your Search Ads campaigns from every angle—keywords, queries, match types, DSA, structure, and scoring. Identify waste, improve ROI, and simplify with data-backed decisions.
Diagnose and optimize your Search Ads campaigns from every angle—keywords, queries, match types, DSA, structure, and scoring. Identify waste, improve ROI, and simplify with data-backed decisions.
Diagnose and optimize your Search Ads campaigns from every angle—keywords, queries, match types, DSA, structure, and scoring. Identify waste, improve ROI, and simplify with data-backed decisions.
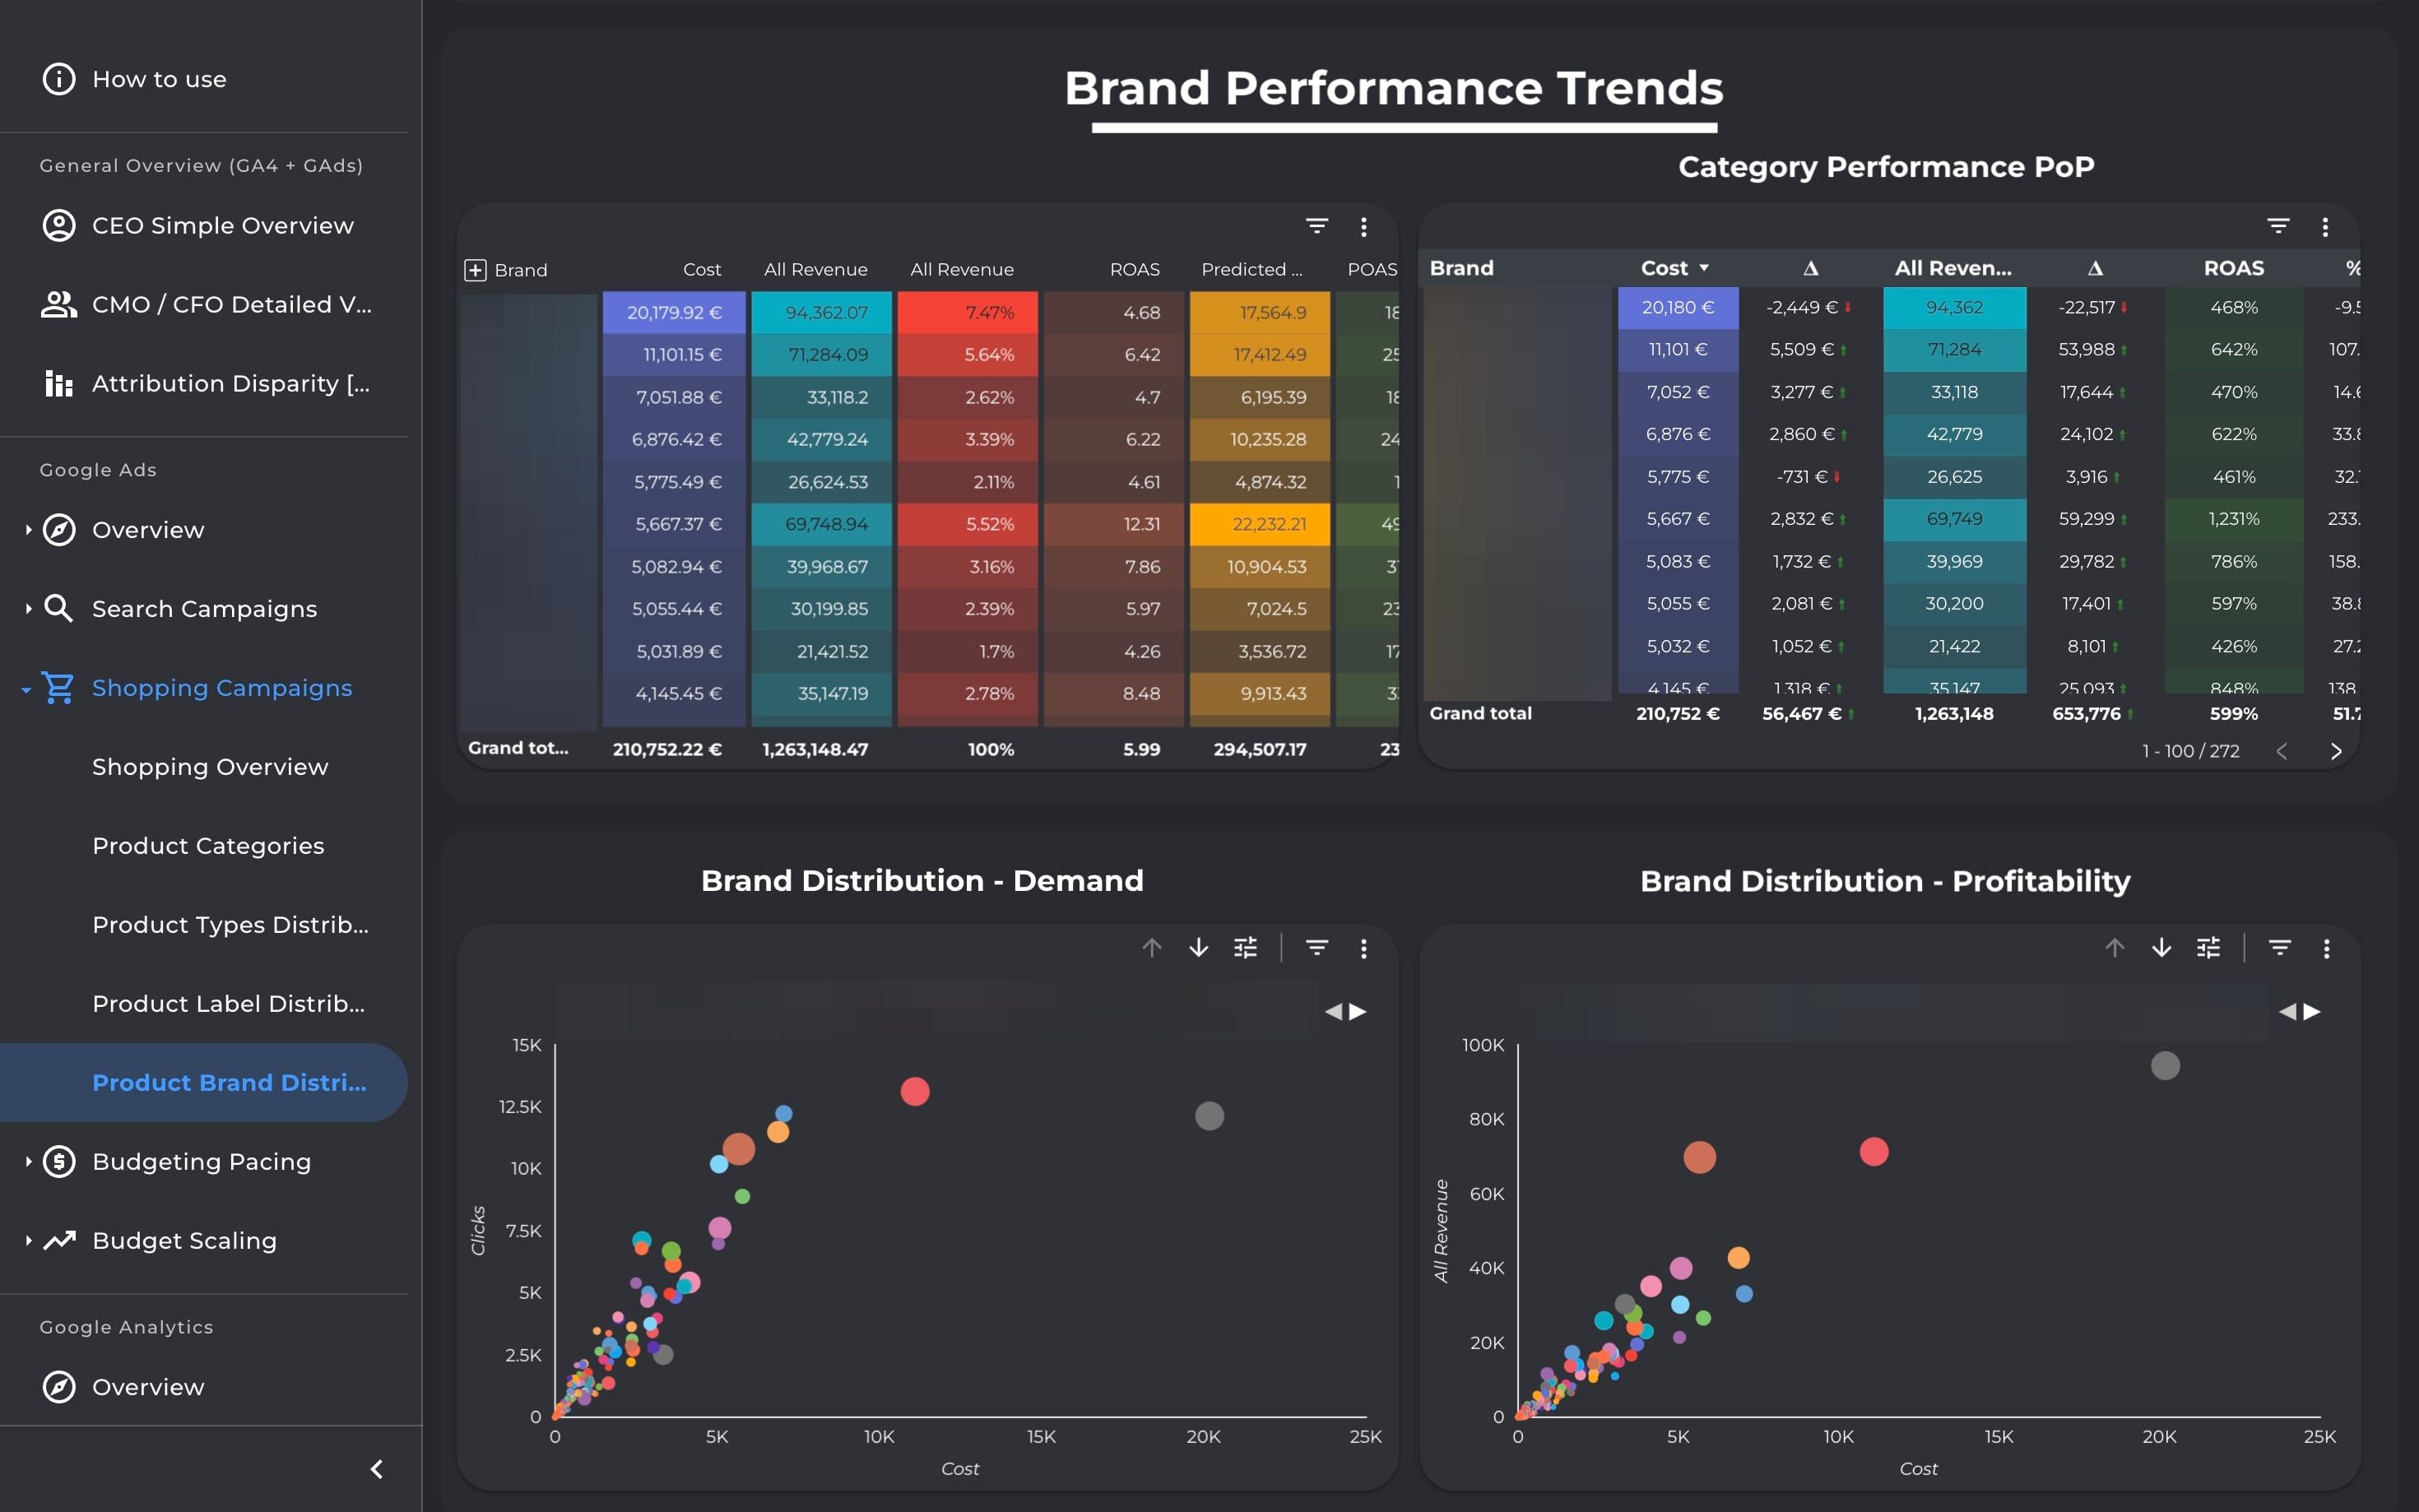
Analyze Shopping & PMax campaign profitability at product level. Drill into categories, brands, and labels to surface bestsellers, optimize structures, and align spend with scalable, high-margin products.
Analyze Shopping & PMax campaign profitability at product level. Drill into categories, brands, and labels to surface bestsellers, optimize structures, and align spend with scalable, high-margin products.
Analyze Shopping & PMax campaign profitability at product level. Drill into categories, brands, and labels to surface bestsellers, optimize structures, and align spend with scalable, high-margin products.
Analyze Shopping & PMax campaign profitability at product level. Drill into categories, brands, and labels to surface bestsellers, optimize structures, and align spend with scalable, high-margin products.