GA4 Promotions & Affiliate Dashboard
GA4 Promotions & Affiliate Dashboard
GA4 Promotions & Affiliate Dashboard
Measure the impact of affiliate partners and promotional campaigns on your revenue.
Measure the impact of affiliate partners and promotional campaigns on your revenue.
Measure the impact of affiliate partners and promotional campaigns on your revenue.
Highlights:
Affiliate revenue contribution and performance breakdown
Gross item revenue by brand and category for affiliate traffic
Seasonal trend visualizations for promotional spikes
Discount impact analysis: revenue vs. discount correlation
Total discount cost and profit erosion estimates
Category-level and brand-level discount breakdown
Cross-filtered tables and trend charts for custom exploration
The Promotions & Incentives report gives you a full view of how affiliate marketing and discount-based promotions are contributing to your bottom line. Perfect for eCommerce marketers and revenue analysts, this dashboard helps answer questions like:
Which affiliates are delivering the most revenue?
Are we over-discounting key products or categories?
Do promotions really boost sessions and purchases—or just cut into margins?
Start by tracking gross revenue per affiliate, visualized over time to surface seasonal trends or spikes tied to specific offers. Use filters to analyze how each affiliate contributes to item revenue, sessions, and purchases.
Dig deeper by exploring revenue breakdowns by brand and category, filtered specifically for affiliate traffic. This helps you identify over-reliance on certain segments and optimize your affiliate partnerships accordingly.
Then, move into the Discount section, where you can:
Correlate discount levels with sales volume and revenue,
Analyze which product categories respond well to discounting,
Review total discount costs and how they affect contribution margin.
The report is fully interactive and cross-filtered, allowing you to click into any affiliate, brand, or category to filter the entire dashboard accordingly. This makes it easy to find high-leverage opportunities to improve efficiency, boost profits, and scale the right campaigns.
Perfect for:
Affiliate managers, eCommerce marketers, DTC brand operators, and anyone responsible for promotional planning or margin optimization.
Other Master Dashboard Pages
Other Master Dashboard Pages
Check out all the pages included in the Master Bundle:
Check out all the pages included in the Master Bundle:
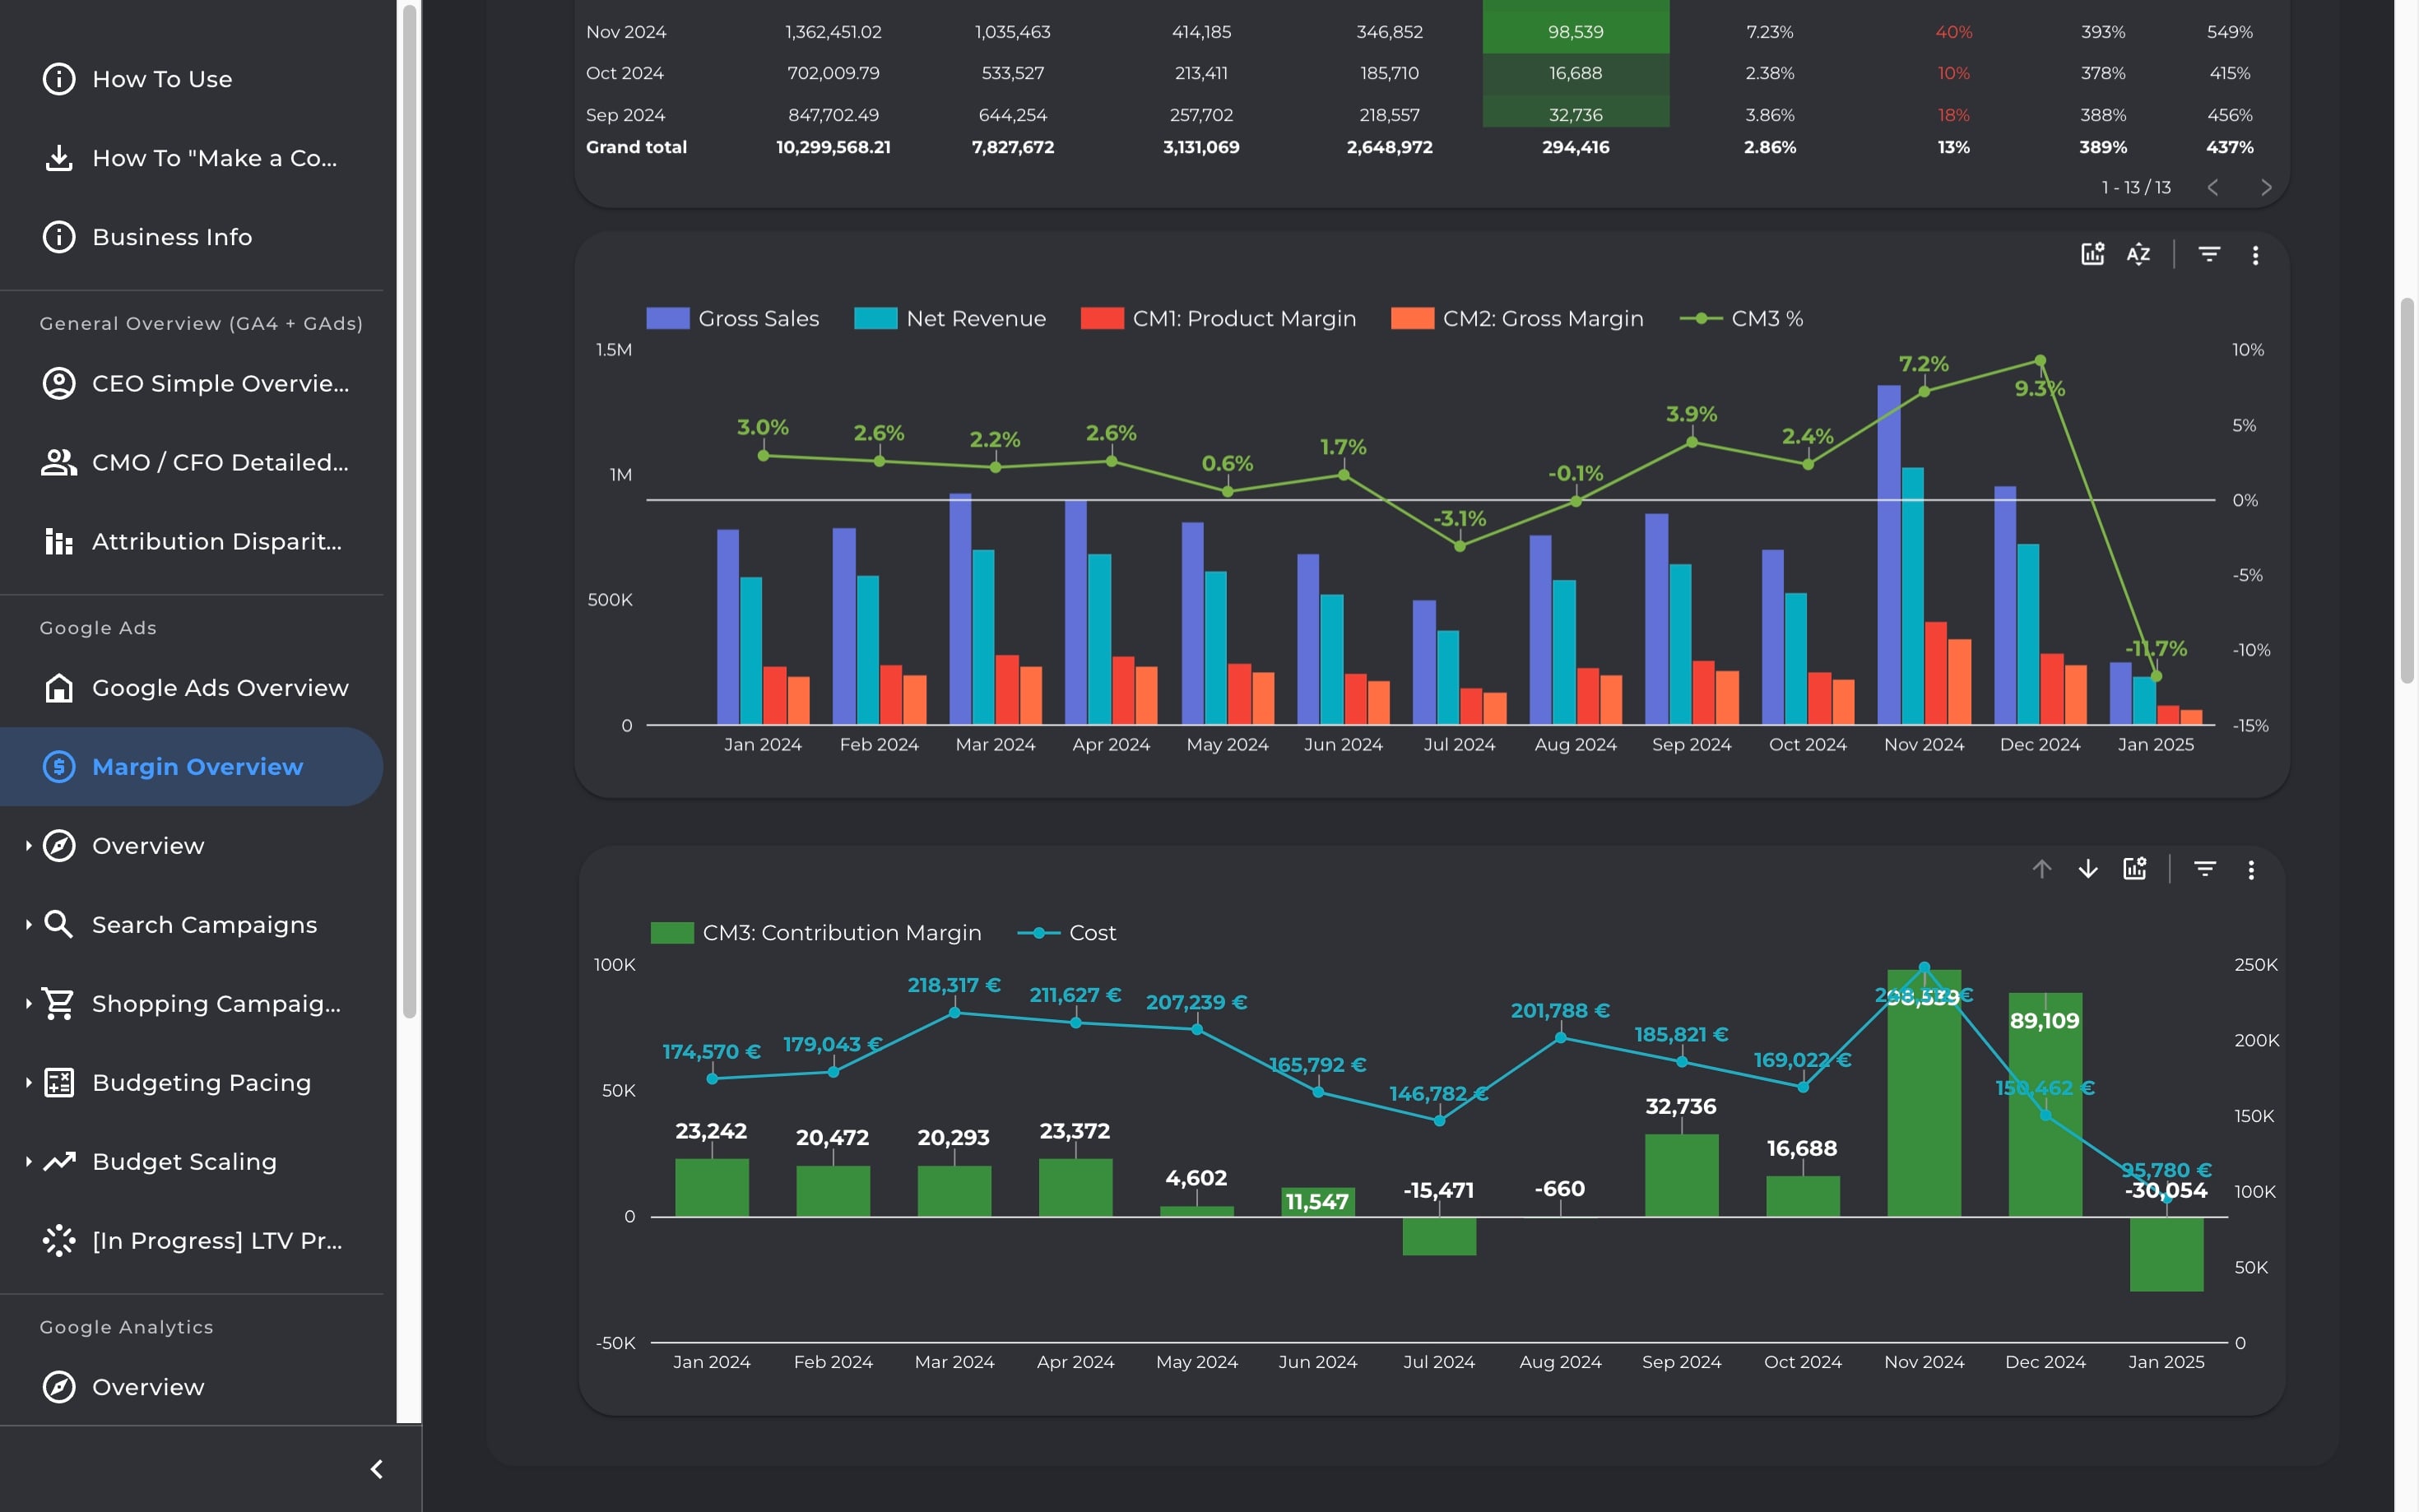
Visualize the full flow from sales to profit with a 3-tier margin breakdown. Estimate contribution margin and break-even ROAS to make smarter, finance-aligned marketing decisions.
Visualize the full flow from sales to profit with a 3-tier margin breakdown. Estimate contribution margin and break-even ROAS to make smarter, finance-aligned marketing decisions.
Visualize the full flow from sales to profit with a 3-tier margin breakdown. Estimate contribution margin and break-even ROAS to make smarter, finance-aligned marketing decisions.
Visualize the full flow from sales to profit with a 3-tier margin breakdown. Estimate contribution margin and break-even ROAS to make smarter, finance-aligned marketing decisions.
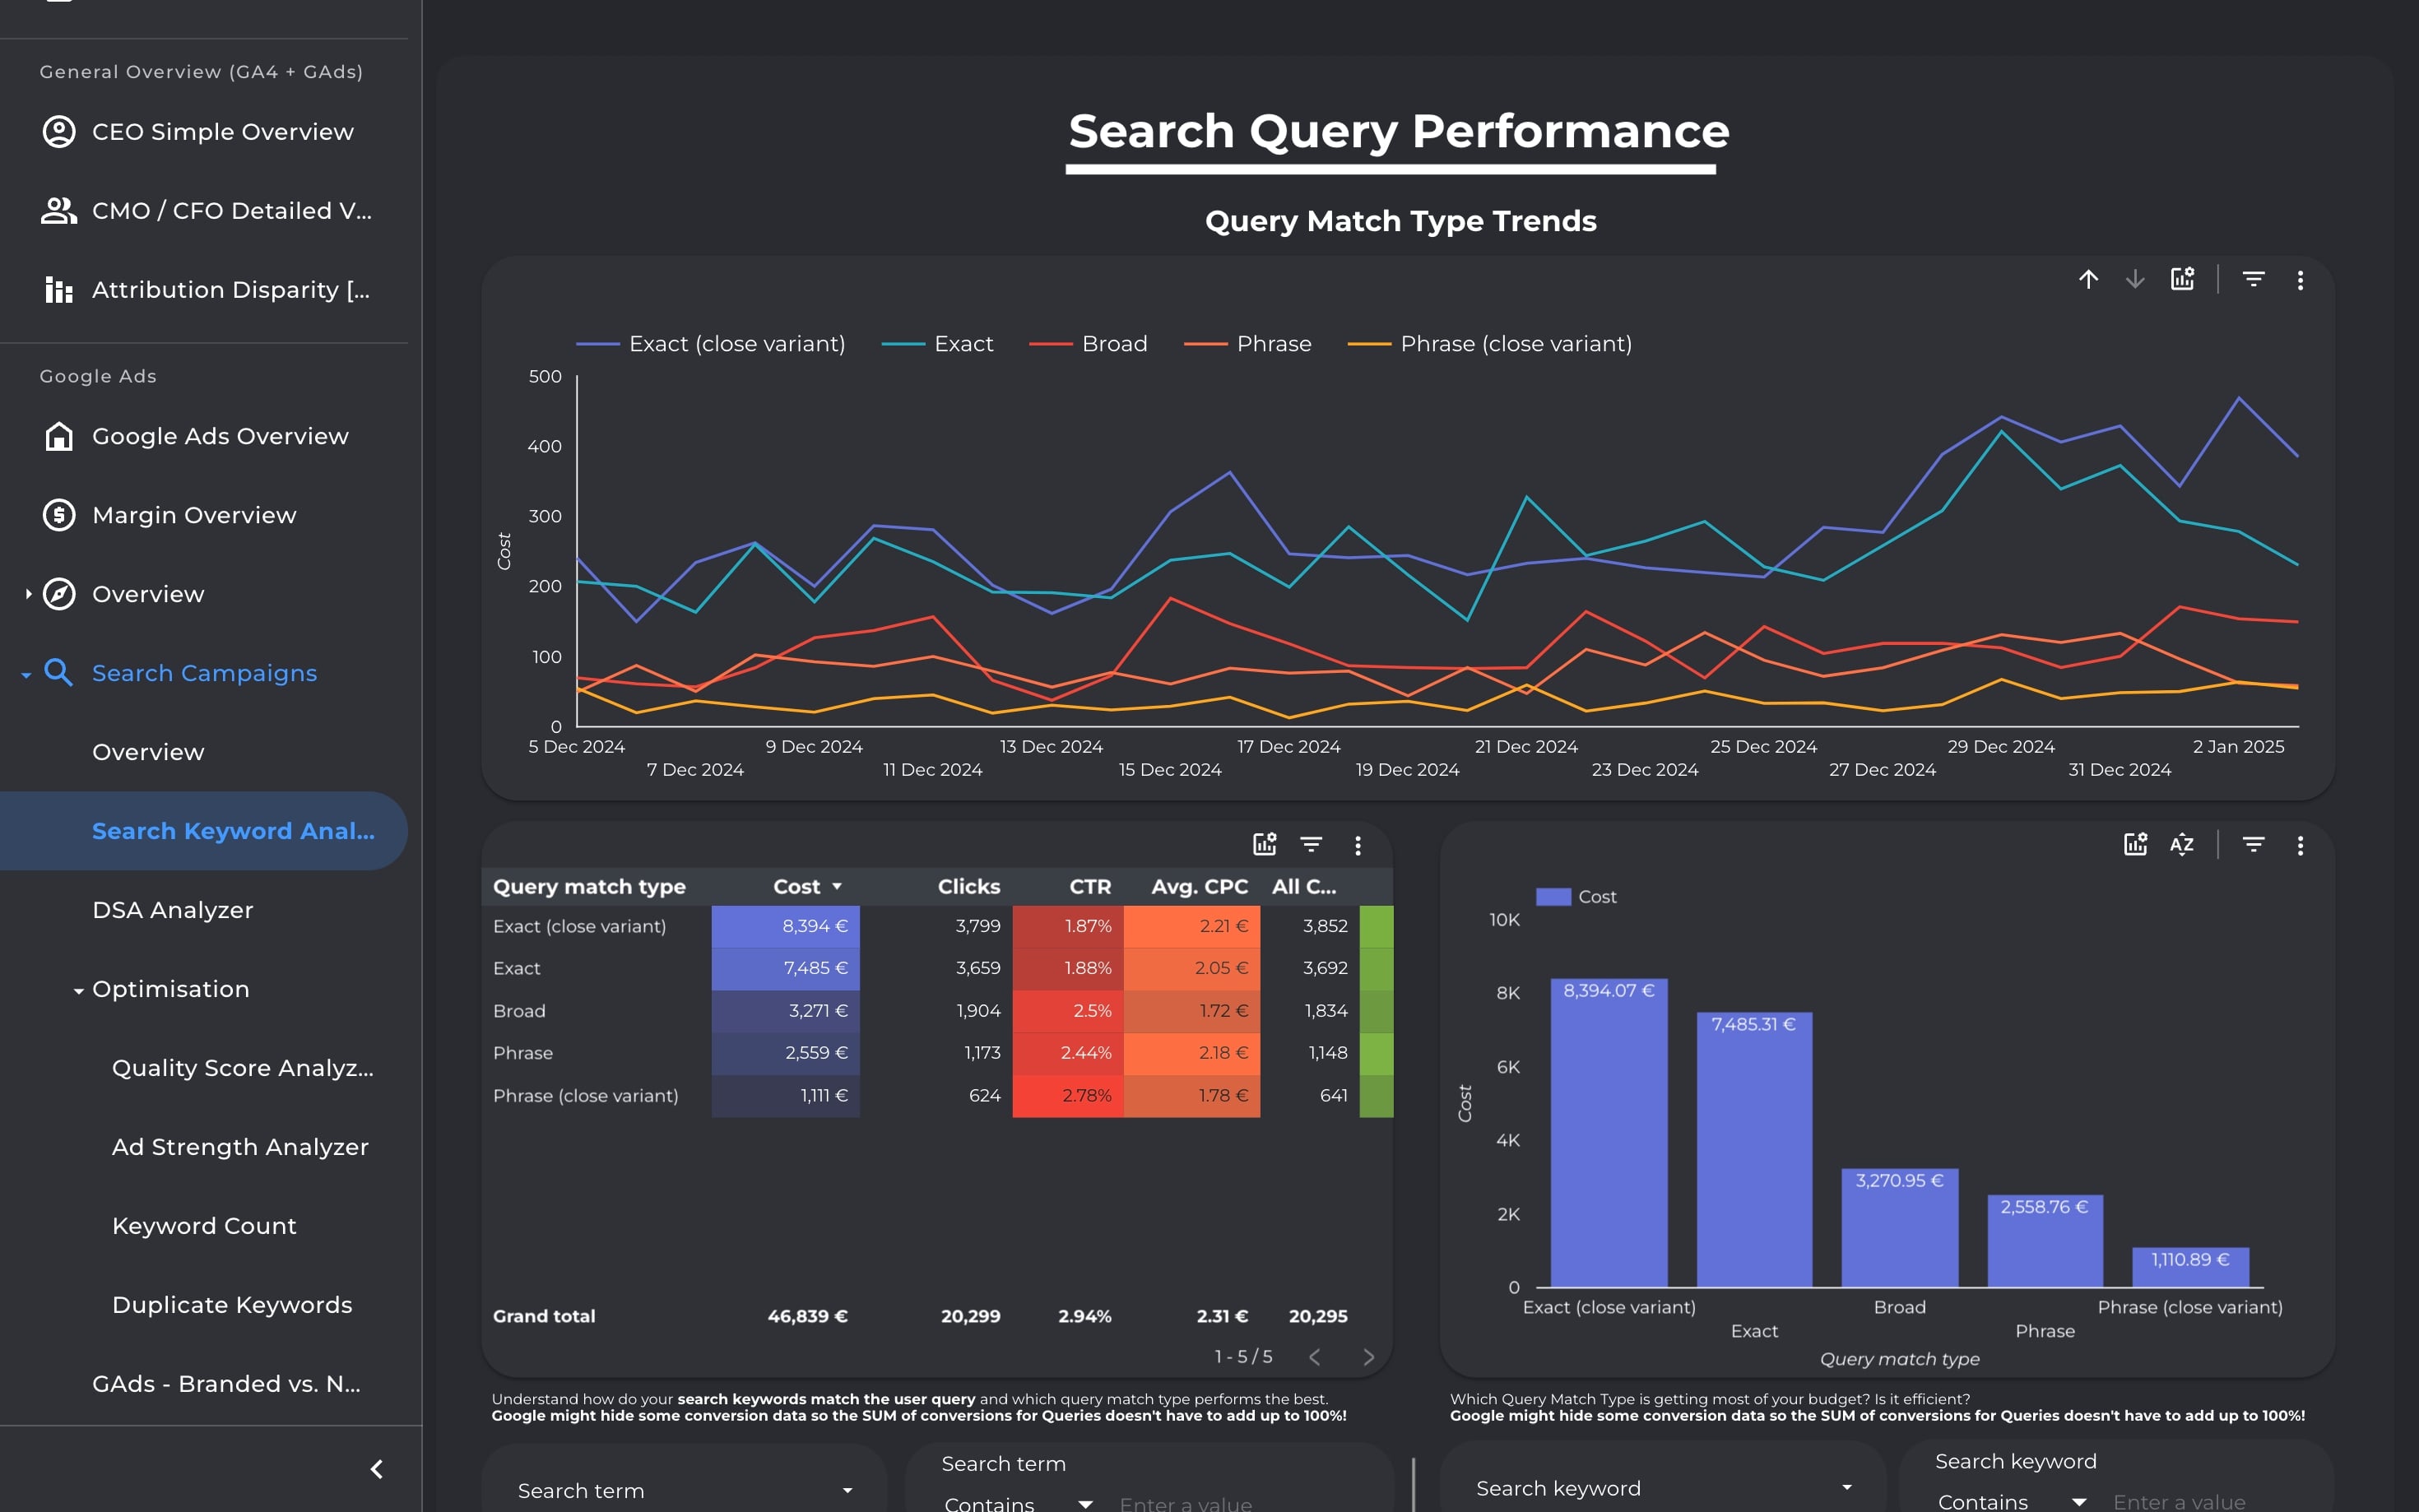
Diagnose and optimize your Search Ads campaigns from every angle—keywords, queries, match types, DSA, structure, and scoring. Identify waste, improve ROI, and simplify with data-backed decisions.
Diagnose and optimize your Search Ads campaigns from every angle—keywords, queries, match types, DSA, structure, and scoring. Identify waste, improve ROI, and simplify with data-backed decisions.
Diagnose and optimize your Search Ads campaigns from every angle—keywords, queries, match types, DSA, structure, and scoring. Identify waste, improve ROI, and simplify with data-backed decisions.
Diagnose and optimize your Search Ads campaigns from every angle—keywords, queries, match types, DSA, structure, and scoring. Identify waste, improve ROI, and simplify with data-backed decisions.
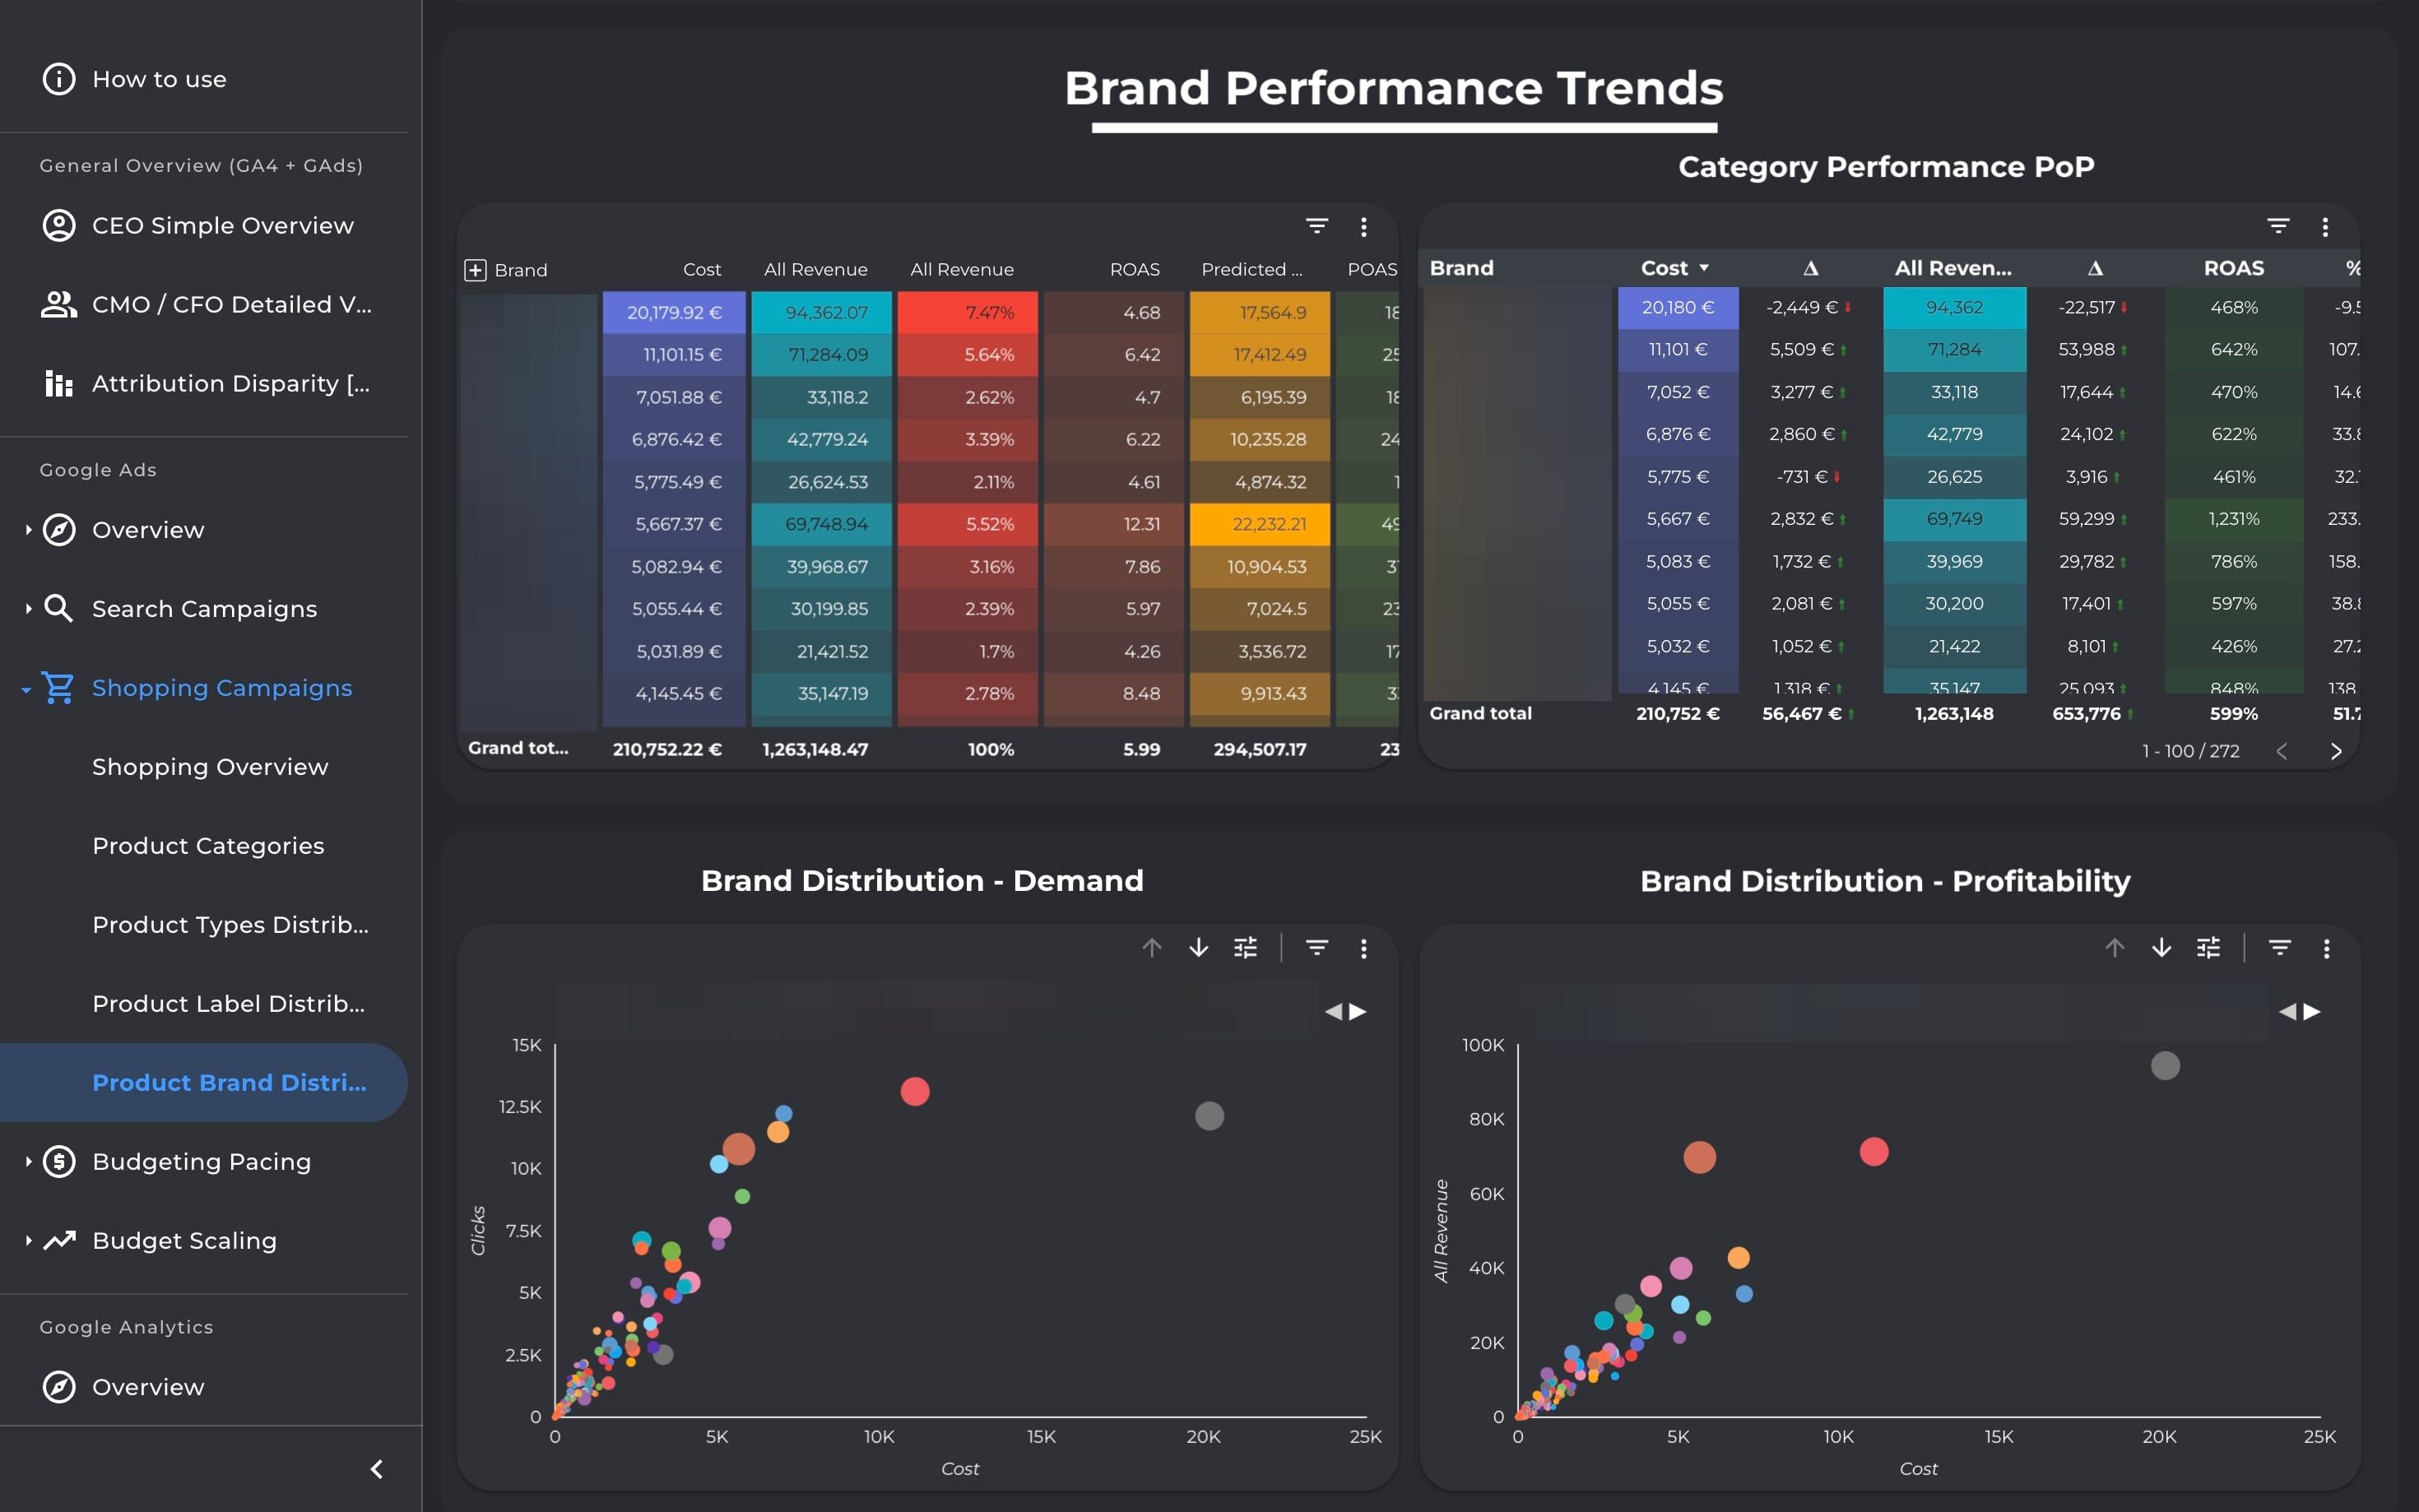
Analyze Shopping & PMax campaign profitability at product level. Drill into categories, brands, and labels to surface bestsellers, optimize structures, and align spend with scalable, high-margin products.
Analyze Shopping & PMax campaign profitability at product level. Drill into categories, brands, and labels to surface bestsellers, optimize structures, and align spend with scalable, high-margin products.
Analyze Shopping & PMax campaign profitability at product level. Drill into categories, brands, and labels to surface bestsellers, optimize structures, and align spend with scalable, high-margin products.
Analyze Shopping & PMax campaign profitability at product level. Drill into categories, brands, and labels to surface bestsellers, optimize structures, and align spend with scalable, high-margin products.