GA4 Audience Comparison – New vs. Returning Customers
GA4 Audience Comparison – New vs. Returning Customers
GA4 Audience Comparison – New vs. Returning Customers
Understand how new and returning users contribute to traffic, purchases, and revenue.
Understand how new and returning users contribute to traffic, purchases, and revenue.
Understand how new and returning users contribute to traffic, purchases, and revenue.
Highlights:
Break down revenue and sessions by new vs. returning users
Session-based vs. revenue-based comparison
Country-level analysis for each segment
Device split to spot mobile vs. desktop behaviors
Audience breakdown by traffic source
Purchase conversion rate and total users by segment
Channel and country comparison for each audience group
Visualize differences in gross purchase revenue between cohorts
This GA4-powered dashboard reveals how new and returning users behave differently on your website. It splits session data, purchases, and revenue to give you an actionable comparison of customer segments.
This is essential for:
Understanding how well your campaigns acquire new customers
Identifying if most of your traffic is from returning audiences
Evaluating the ROI of performance marketing vs. loyalty channels like email
The dashboard breaks down:
Revenue and purchase volume for new vs. returning sessions
Conversion rate differences between the segments
Country- and device-level splits to uncover hidden performance patterns
Channel analysis to assess which sources bring loyal vs. first-time customers
You’ll also see time series graphs to help spot behavior shifts during events like Black Friday or after major campaigns.
This view is perfect for retention marketers, performance managers, and founders who want to optimize their full-funnel strategy - from acquisition to loyalty.
Other Master Dashboard Pages
Other Master Dashboard Pages
Check out all the pages included in the Master Bundle:
Check out all the pages included in the Master Bundle:
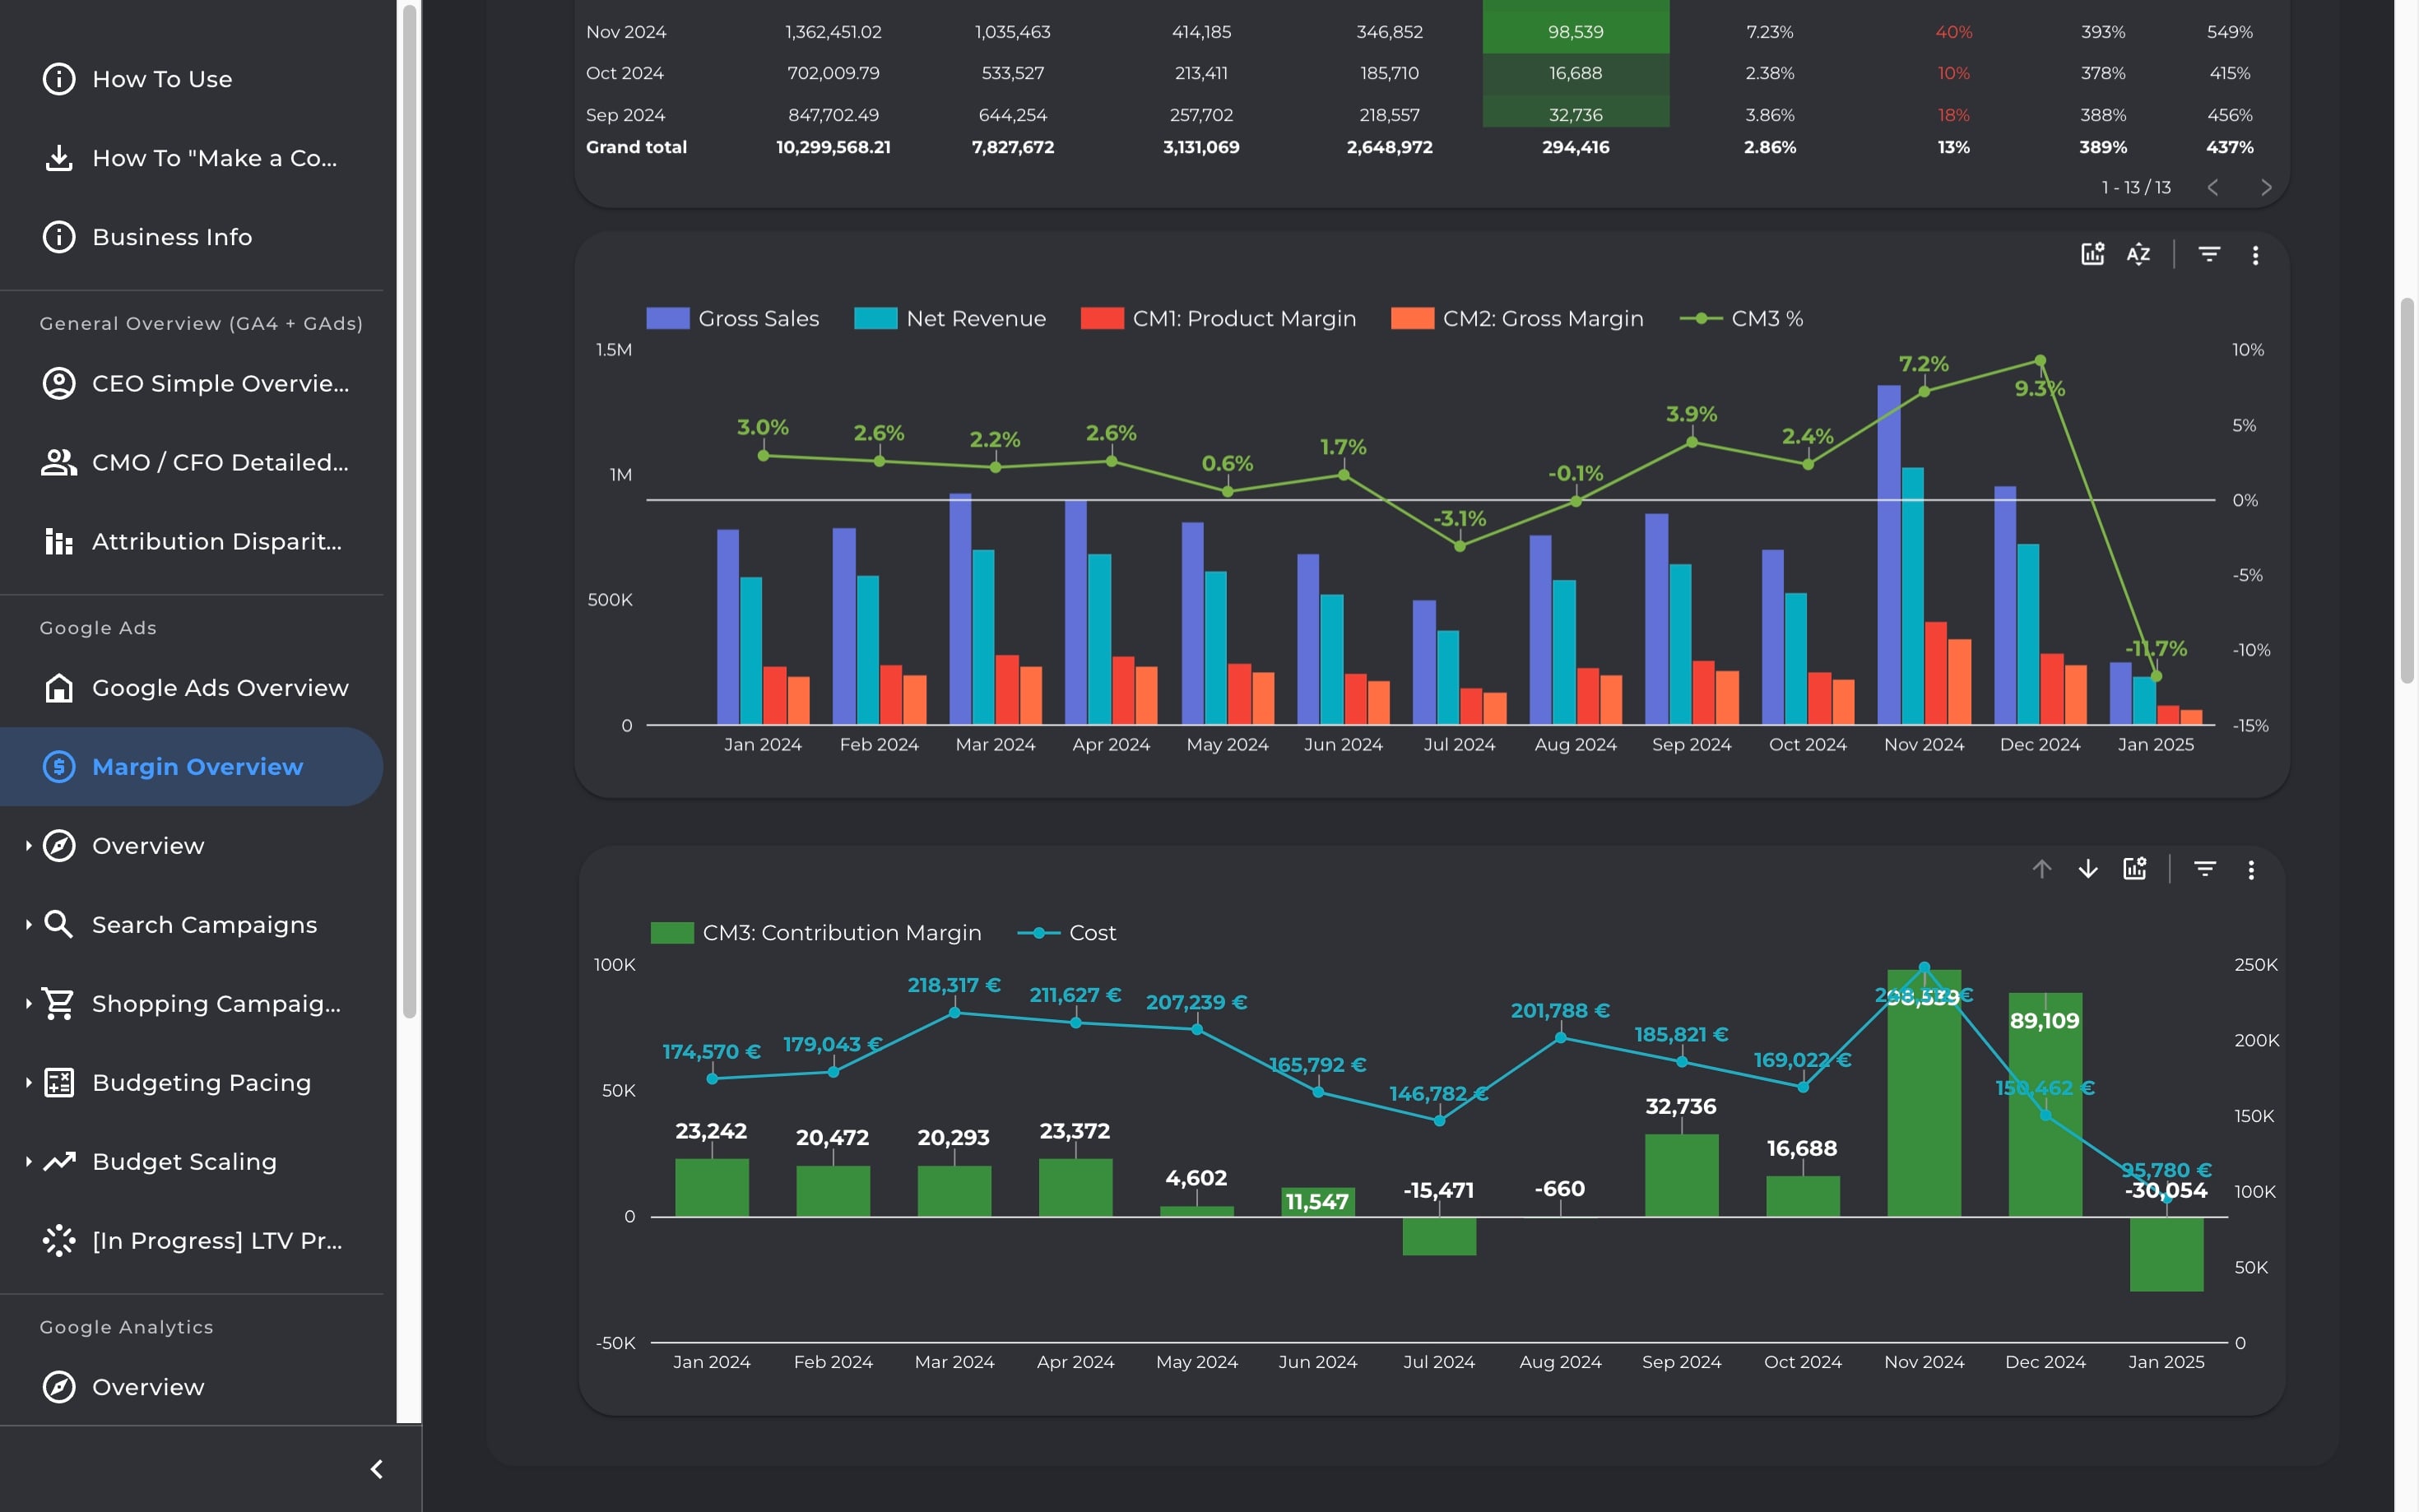
Visualize the full flow from sales to profit with a 3-tier margin breakdown. Estimate contribution margin and break-even ROAS to make smarter, finance-aligned marketing decisions.
Visualize the full flow from sales to profit with a 3-tier margin breakdown. Estimate contribution margin and break-even ROAS to make smarter, finance-aligned marketing decisions.
Visualize the full flow from sales to profit with a 3-tier margin breakdown. Estimate contribution margin and break-even ROAS to make smarter, finance-aligned marketing decisions.
Visualize the full flow from sales to profit with a 3-tier margin breakdown. Estimate contribution margin and break-even ROAS to make smarter, finance-aligned marketing decisions.
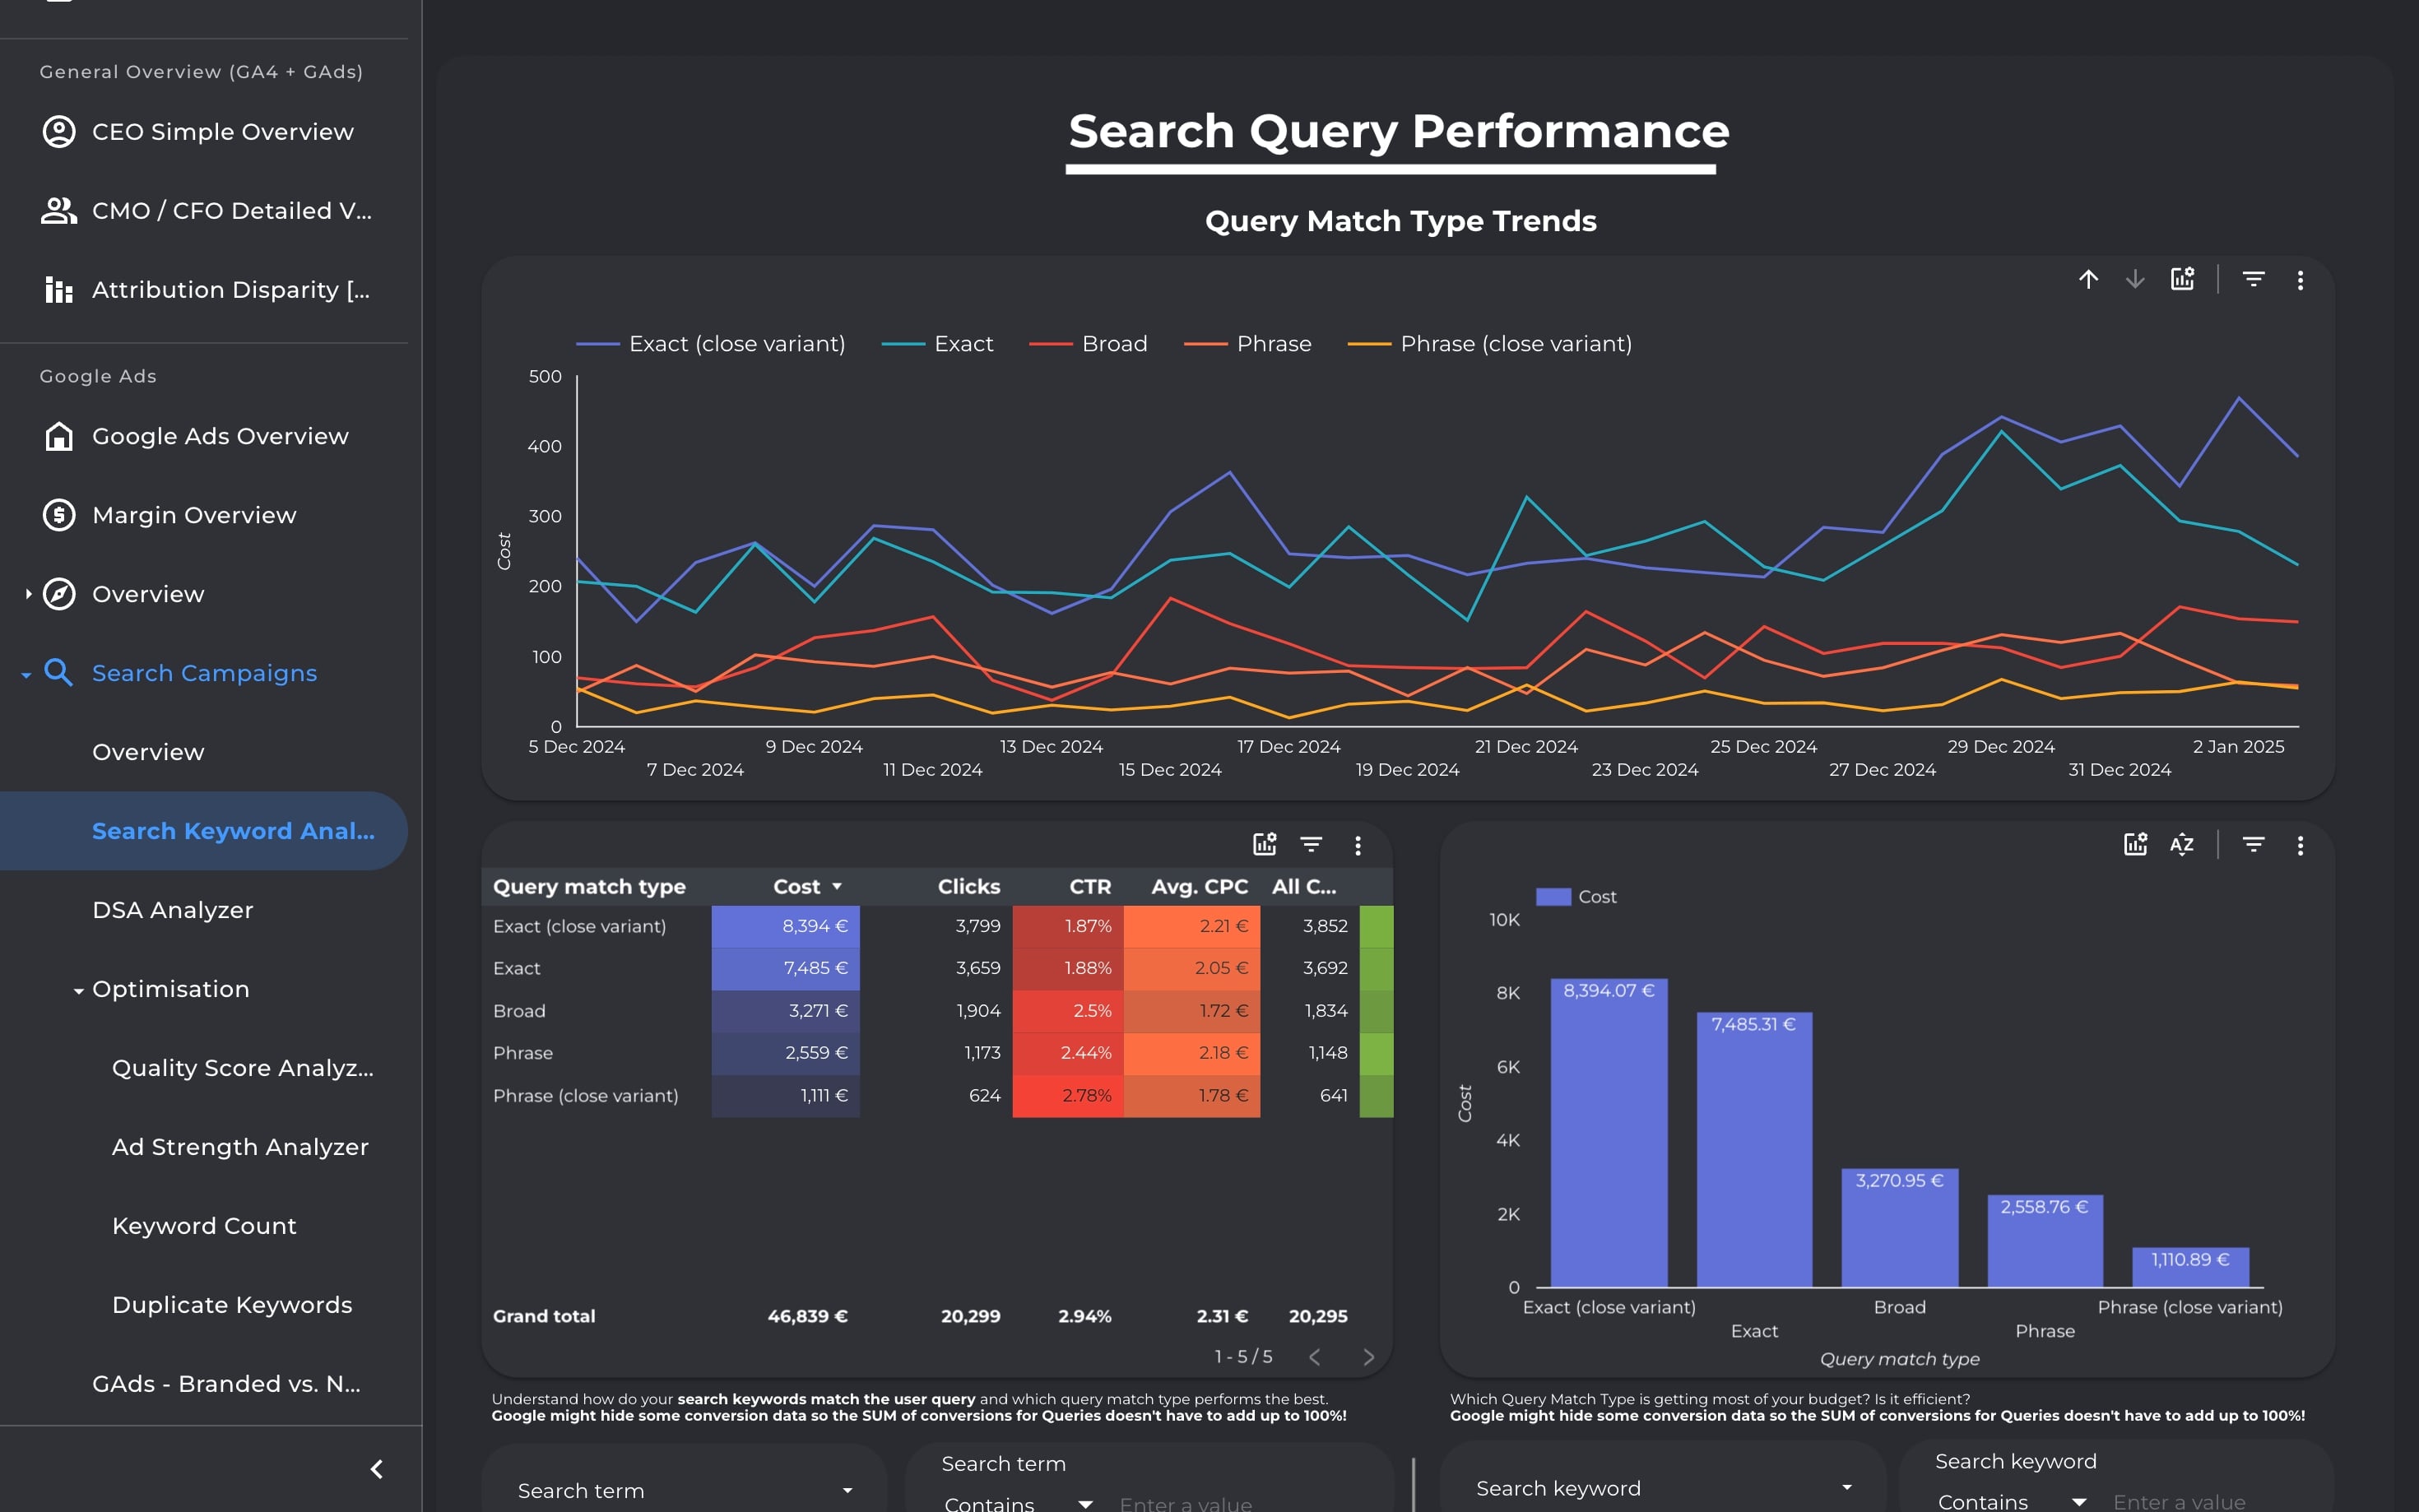
Diagnose and optimize your Search Ads campaigns from every angle—keywords, queries, match types, DSA, structure, and scoring. Identify waste, improve ROI, and simplify with data-backed decisions.
Diagnose and optimize your Search Ads campaigns from every angle—keywords, queries, match types, DSA, structure, and scoring. Identify waste, improve ROI, and simplify with data-backed decisions.
Diagnose and optimize your Search Ads campaigns from every angle—keywords, queries, match types, DSA, structure, and scoring. Identify waste, improve ROI, and simplify with data-backed decisions.
Diagnose and optimize your Search Ads campaigns from every angle—keywords, queries, match types, DSA, structure, and scoring. Identify waste, improve ROI, and simplify with data-backed decisions.
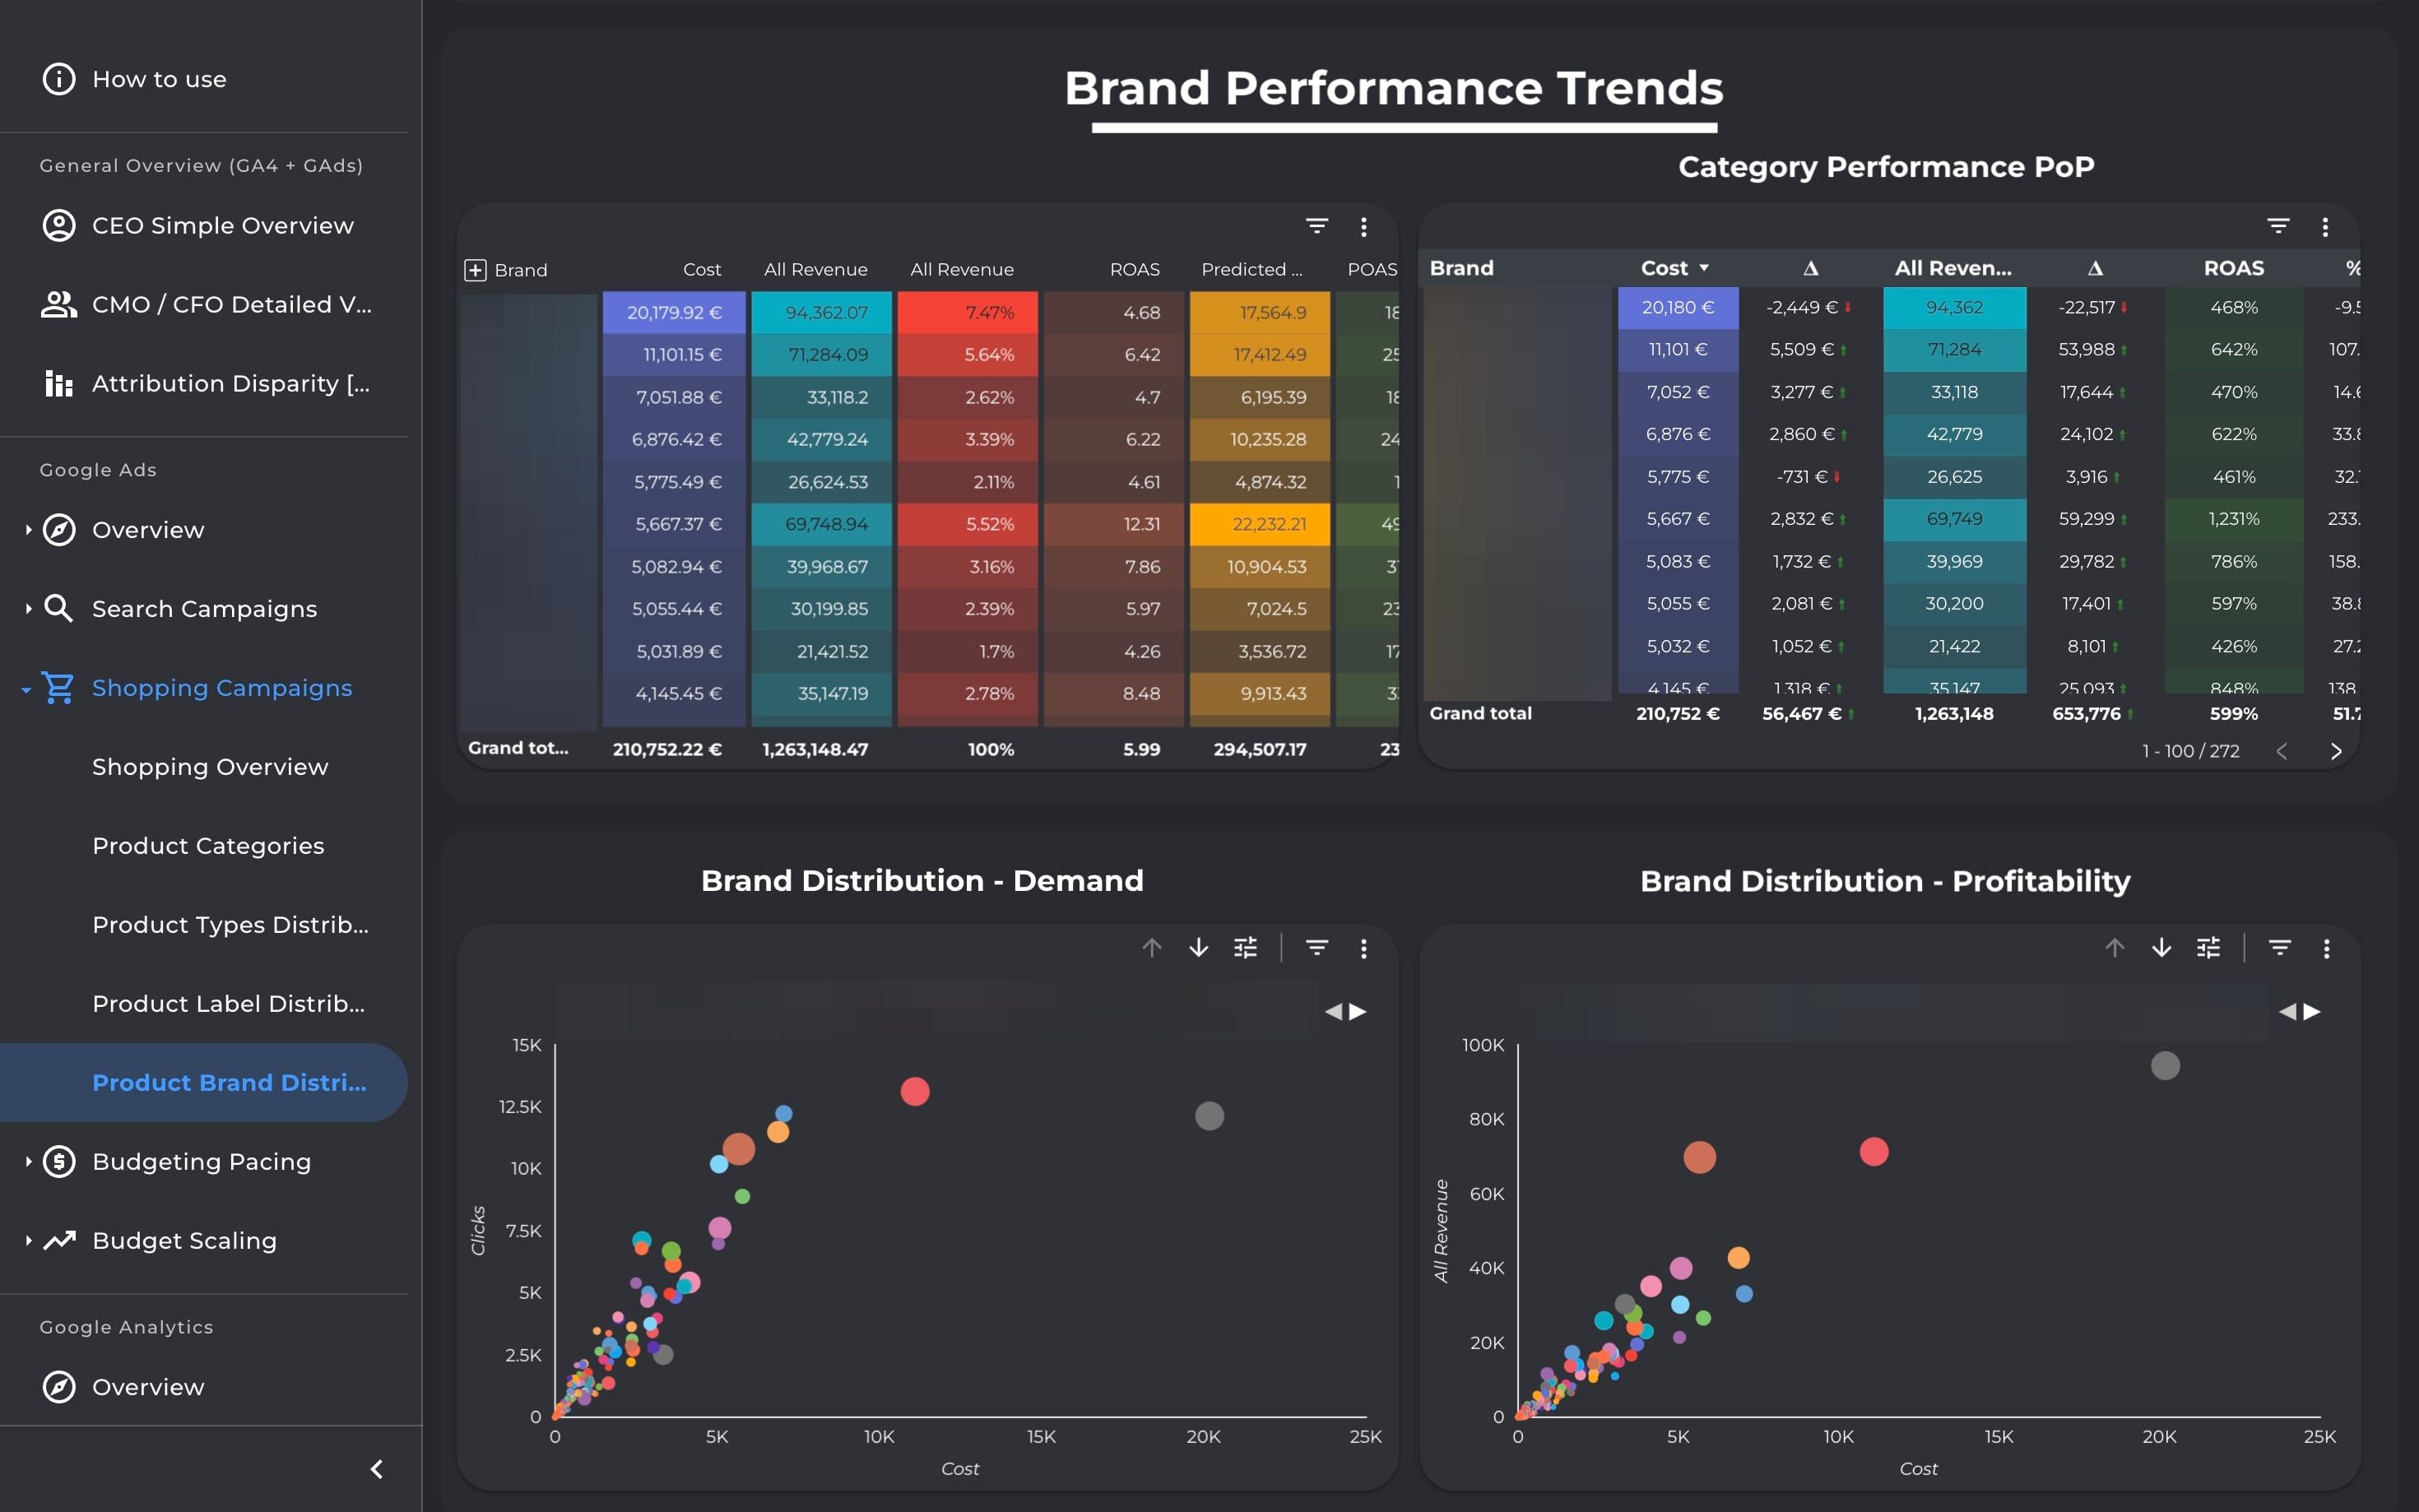
Analyze Shopping & PMax campaign profitability at product level. Drill into categories, brands, and labels to surface bestsellers, optimize structures, and align spend with scalable, high-margin products.
Analyze Shopping & PMax campaign profitability at product level. Drill into categories, brands, and labels to surface bestsellers, optimize structures, and align spend with scalable, high-margin products.
Analyze Shopping & PMax campaign profitability at product level. Drill into categories, brands, and labels to surface bestsellers, optimize structures, and align spend with scalable, high-margin products.
Analyze Shopping & PMax campaign profitability at product level. Drill into categories, brands, and labels to surface bestsellers, optimize structures, and align spend with scalable, high-margin products.