GA4 Geo & Device Performance – Location & Device-Based Optimization
GA4 Geo & Device Performance – Location & Device-Based Optimization
GA4 Geo & Device Performance – Location & Device-Based Optimization
Analyze revenue and traffic performance by country, region, city, and device to tailor your campaigns for better efficiency.
Analyze revenue and traffic performance by country, region, city, and device to tailor your campaigns for better efficiency.
Analyze revenue and traffic performance by country, region, city, and device to tailor your campaigns for better efficiency.
Highlights:
Country-level performance heatmap and metrics
City-level drilldown for localized trends
Global session vs. revenue scatter plots
Country-specific revenue, conversion rate, and AOV comparison
Device performance overview: category, brand, model
Purchase conversion rate breakdown by device
Time series trends for country and device performance
Fully interactive filtering across all components
This report offers a comprehensive overview of your eCommerce performance segmented by geography and device.
It’s ideal for marketers, eCommerce managers, or CRO specialists looking to understand how regional and technological factors impact performance.
At the geographic level, track the countries (and cities) that drive the most revenue, sessions, and purchases. Use the heatmap and visual comparisons to quickly spot where your efforts are paying off—or falling short.
Break down metrics like Cart Conversion Rate, Checkout Rate, and AOV to spot regional strengths or drop-offs.
On the device side, uncover which platforms perform best: mobile, desktop, tablet, or even smart TVs. Go deeper by analyzing performance by brand or device model to identify optimization opportunities across UX, speed, or layout.
Whether you’re planning international expansion or optimizing landing pages by device type, this report helps you:
Prioritize high-performing regions and devices
Adjust ad bids or budgets by geography
Identify low-CR countries or device types
Maximize profitability through targeted insights
Everything is cross-filtered, making exploration seamless and actionable.
Other Master Dashboard Pages
Other Master Dashboard Pages
Check out all the pages included in the Master Bundle:
Check out all the pages included in the Master Bundle:
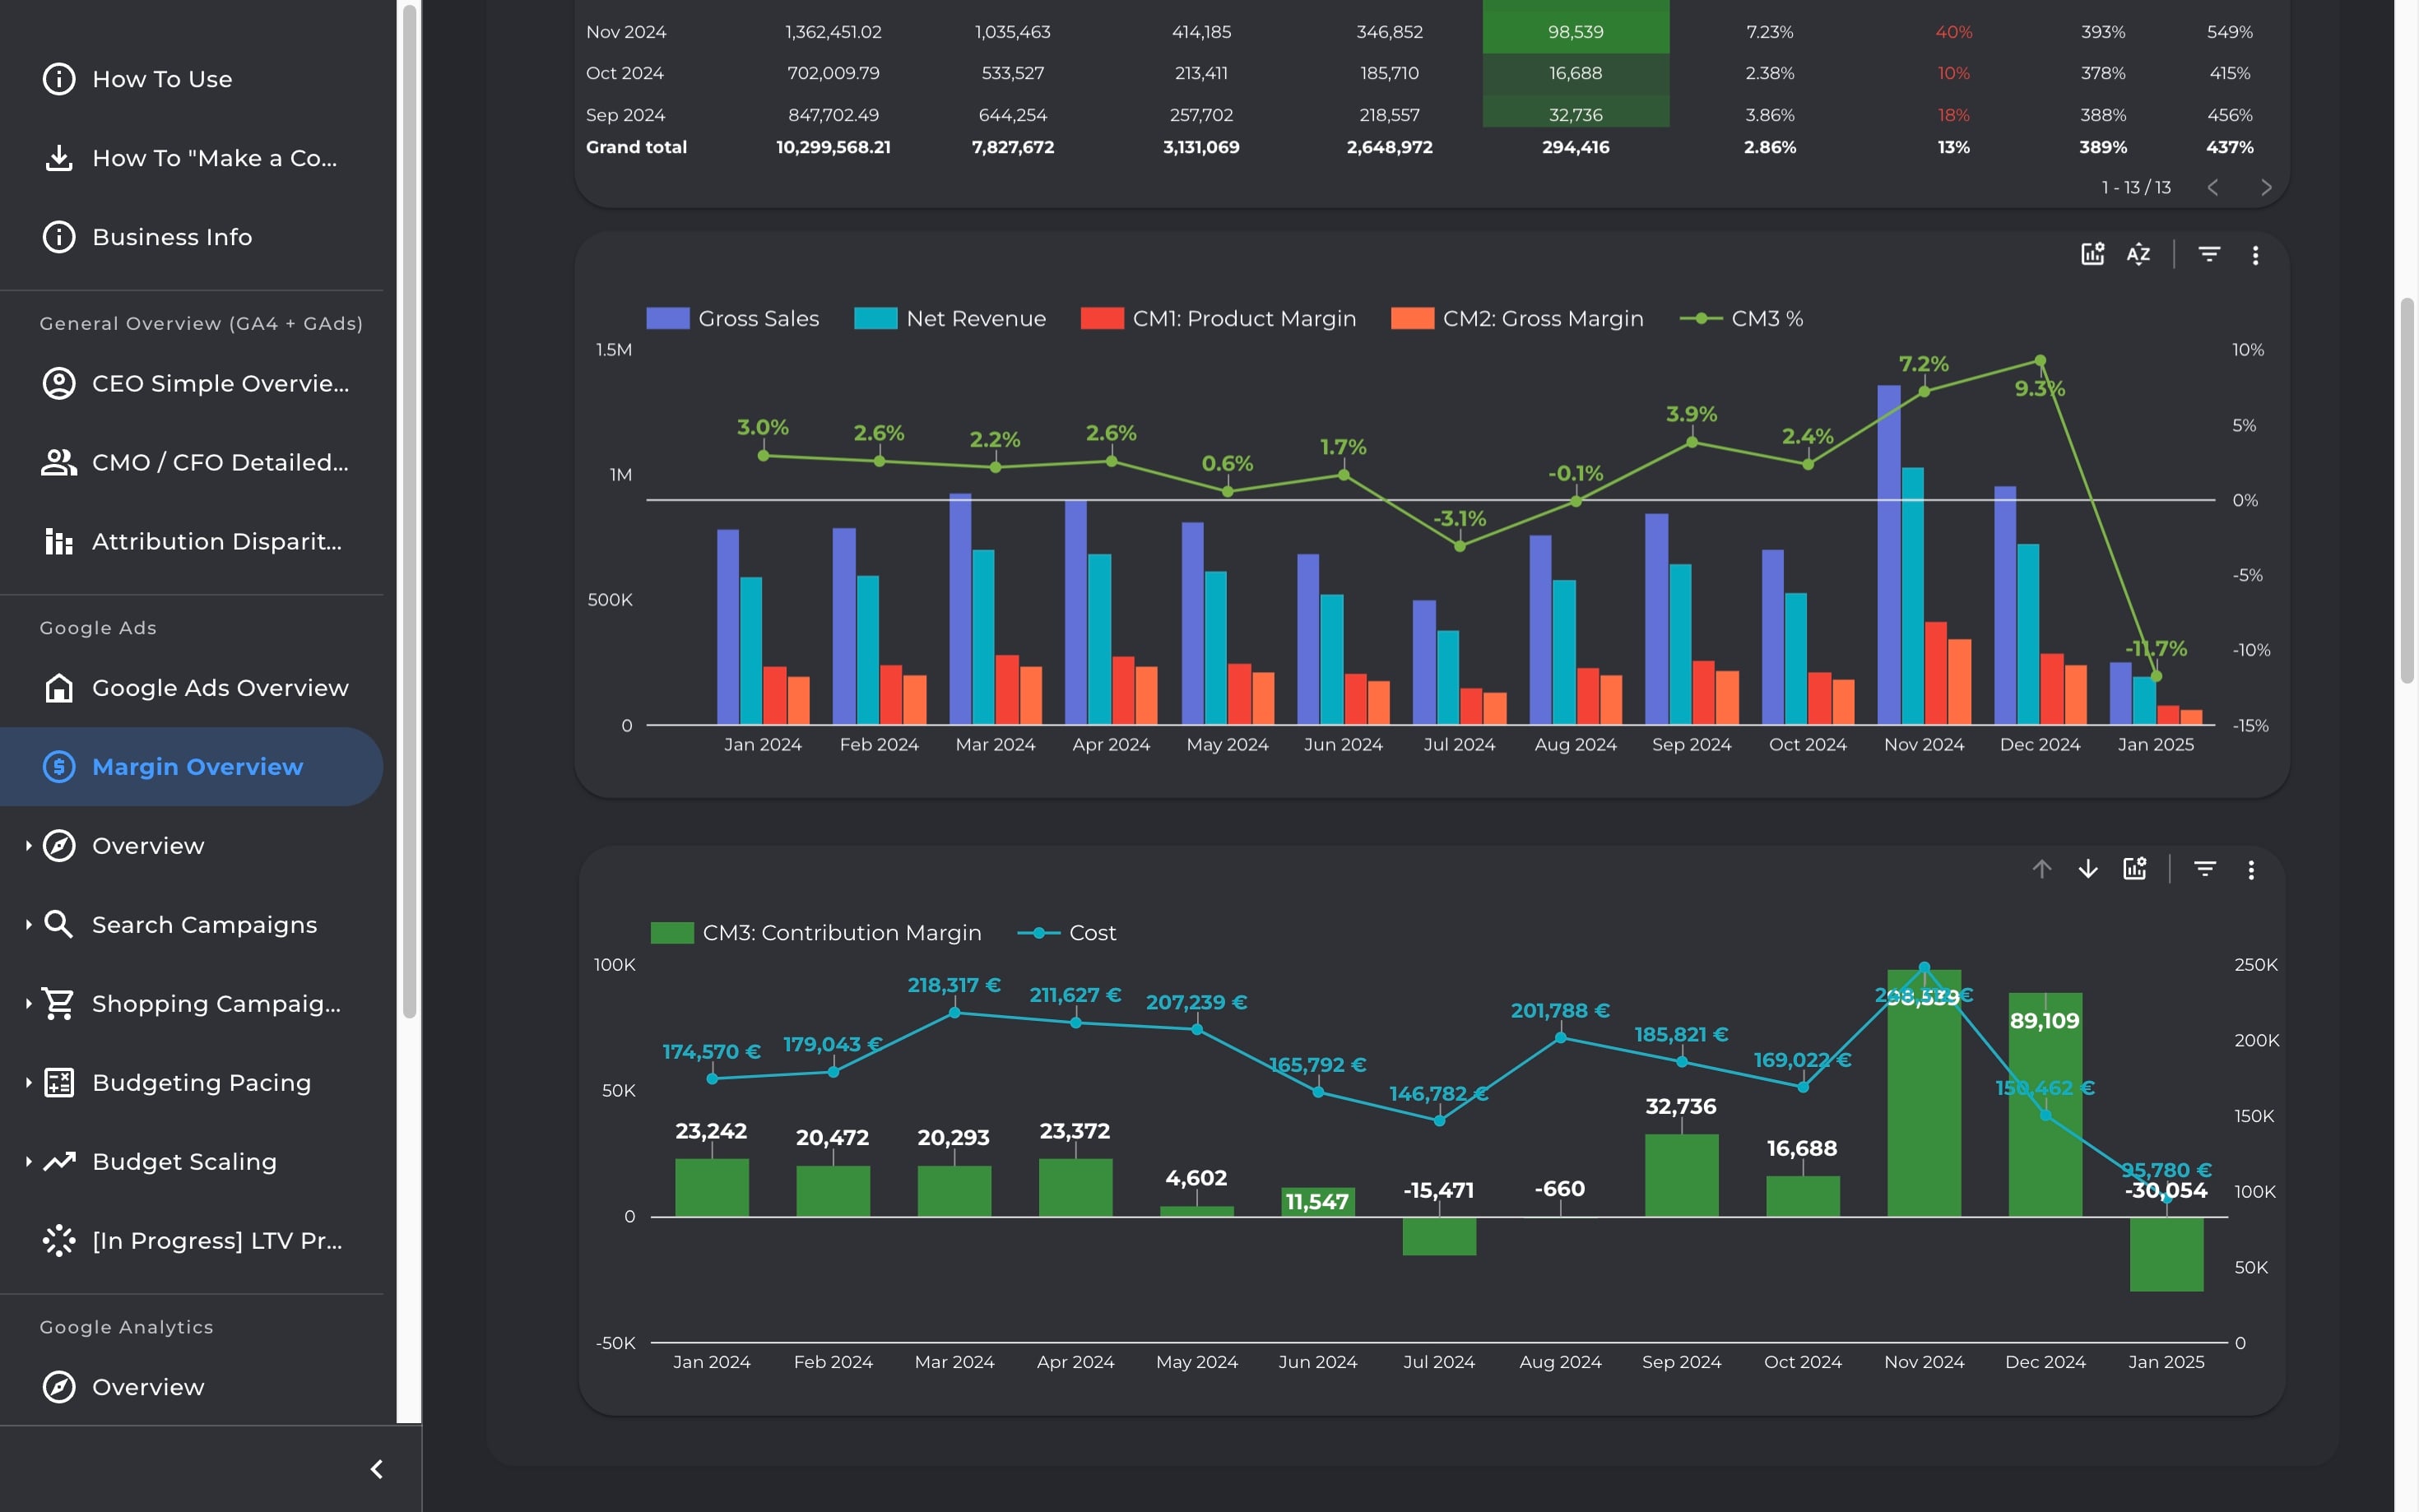
Visualize the full flow from sales to profit with a 3-tier margin breakdown. Estimate contribution margin and break-even ROAS to make smarter, finance-aligned marketing decisions.
Visualize the full flow from sales to profit with a 3-tier margin breakdown. Estimate contribution margin and break-even ROAS to make smarter, finance-aligned marketing decisions.
Visualize the full flow from sales to profit with a 3-tier margin breakdown. Estimate contribution margin and break-even ROAS to make smarter, finance-aligned marketing decisions.
Visualize the full flow from sales to profit with a 3-tier margin breakdown. Estimate contribution margin and break-even ROAS to make smarter, finance-aligned marketing decisions.
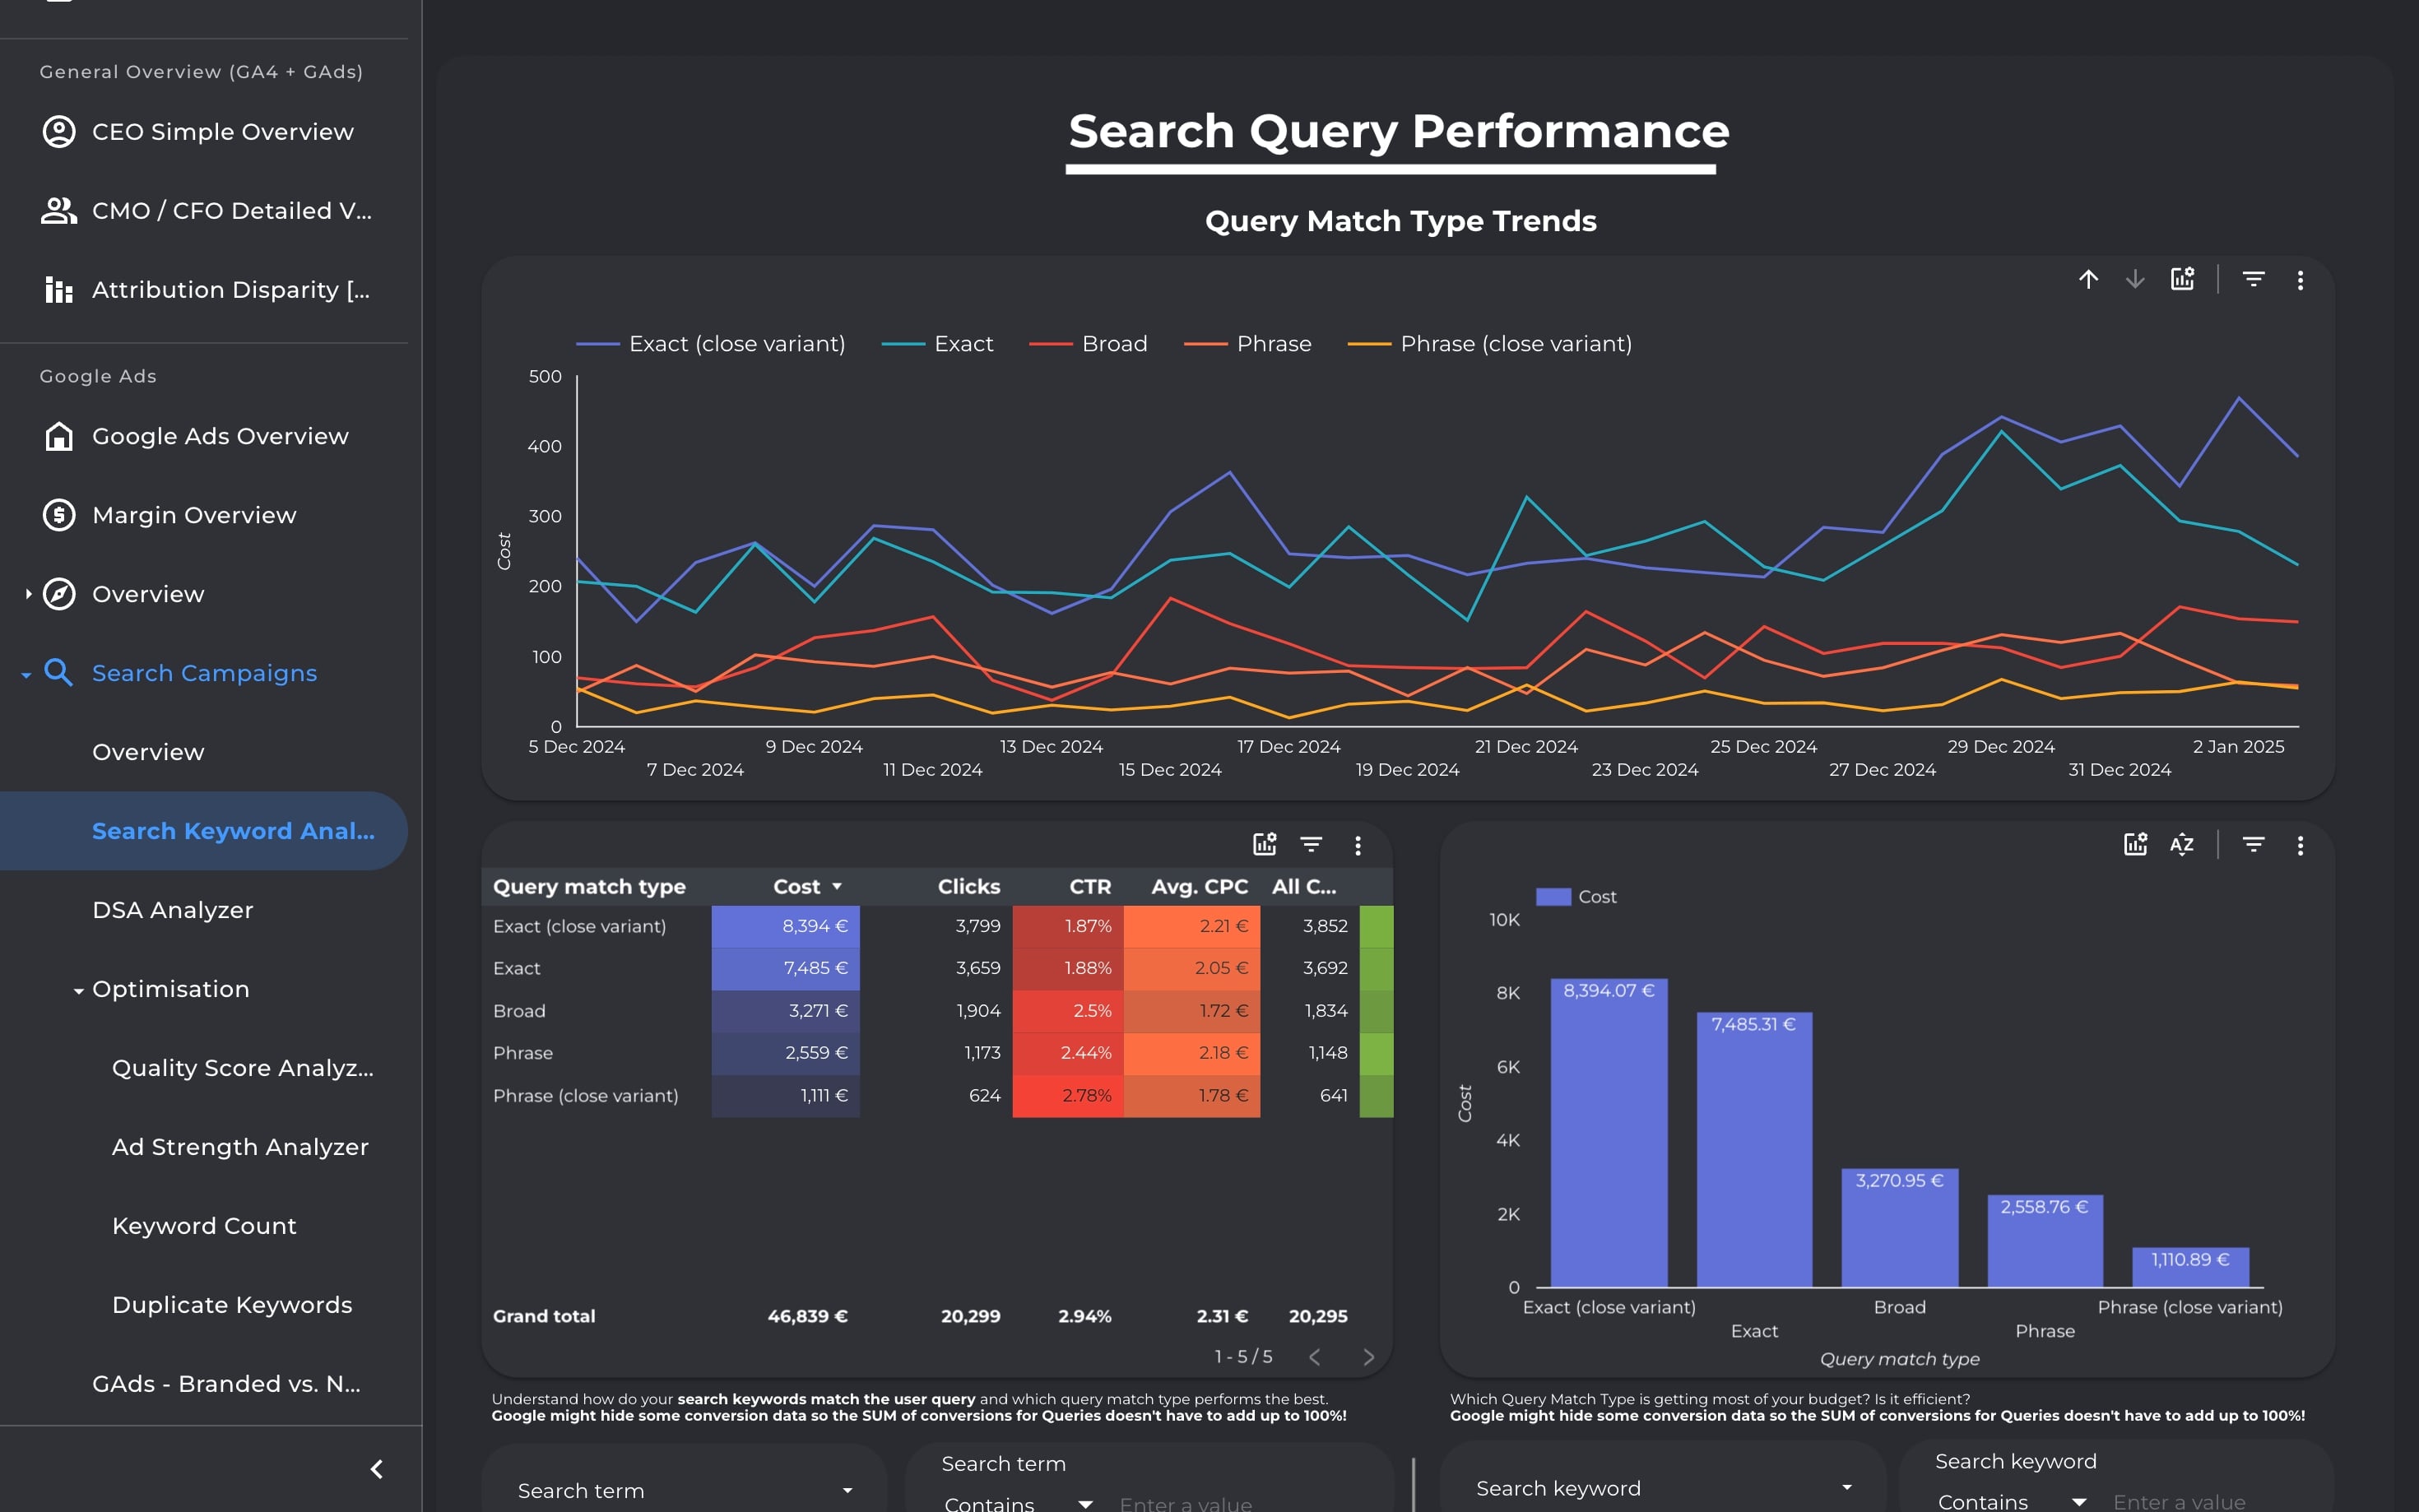
Diagnose and optimize your Search Ads campaigns from every angle—keywords, queries, match types, DSA, structure, and scoring. Identify waste, improve ROI, and simplify with data-backed decisions.
Diagnose and optimize your Search Ads campaigns from every angle—keywords, queries, match types, DSA, structure, and scoring. Identify waste, improve ROI, and simplify with data-backed decisions.
Diagnose and optimize your Search Ads campaigns from every angle—keywords, queries, match types, DSA, structure, and scoring. Identify waste, improve ROI, and simplify with data-backed decisions.
Diagnose and optimize your Search Ads campaigns from every angle—keywords, queries, match types, DSA, structure, and scoring. Identify waste, improve ROI, and simplify with data-backed decisions.
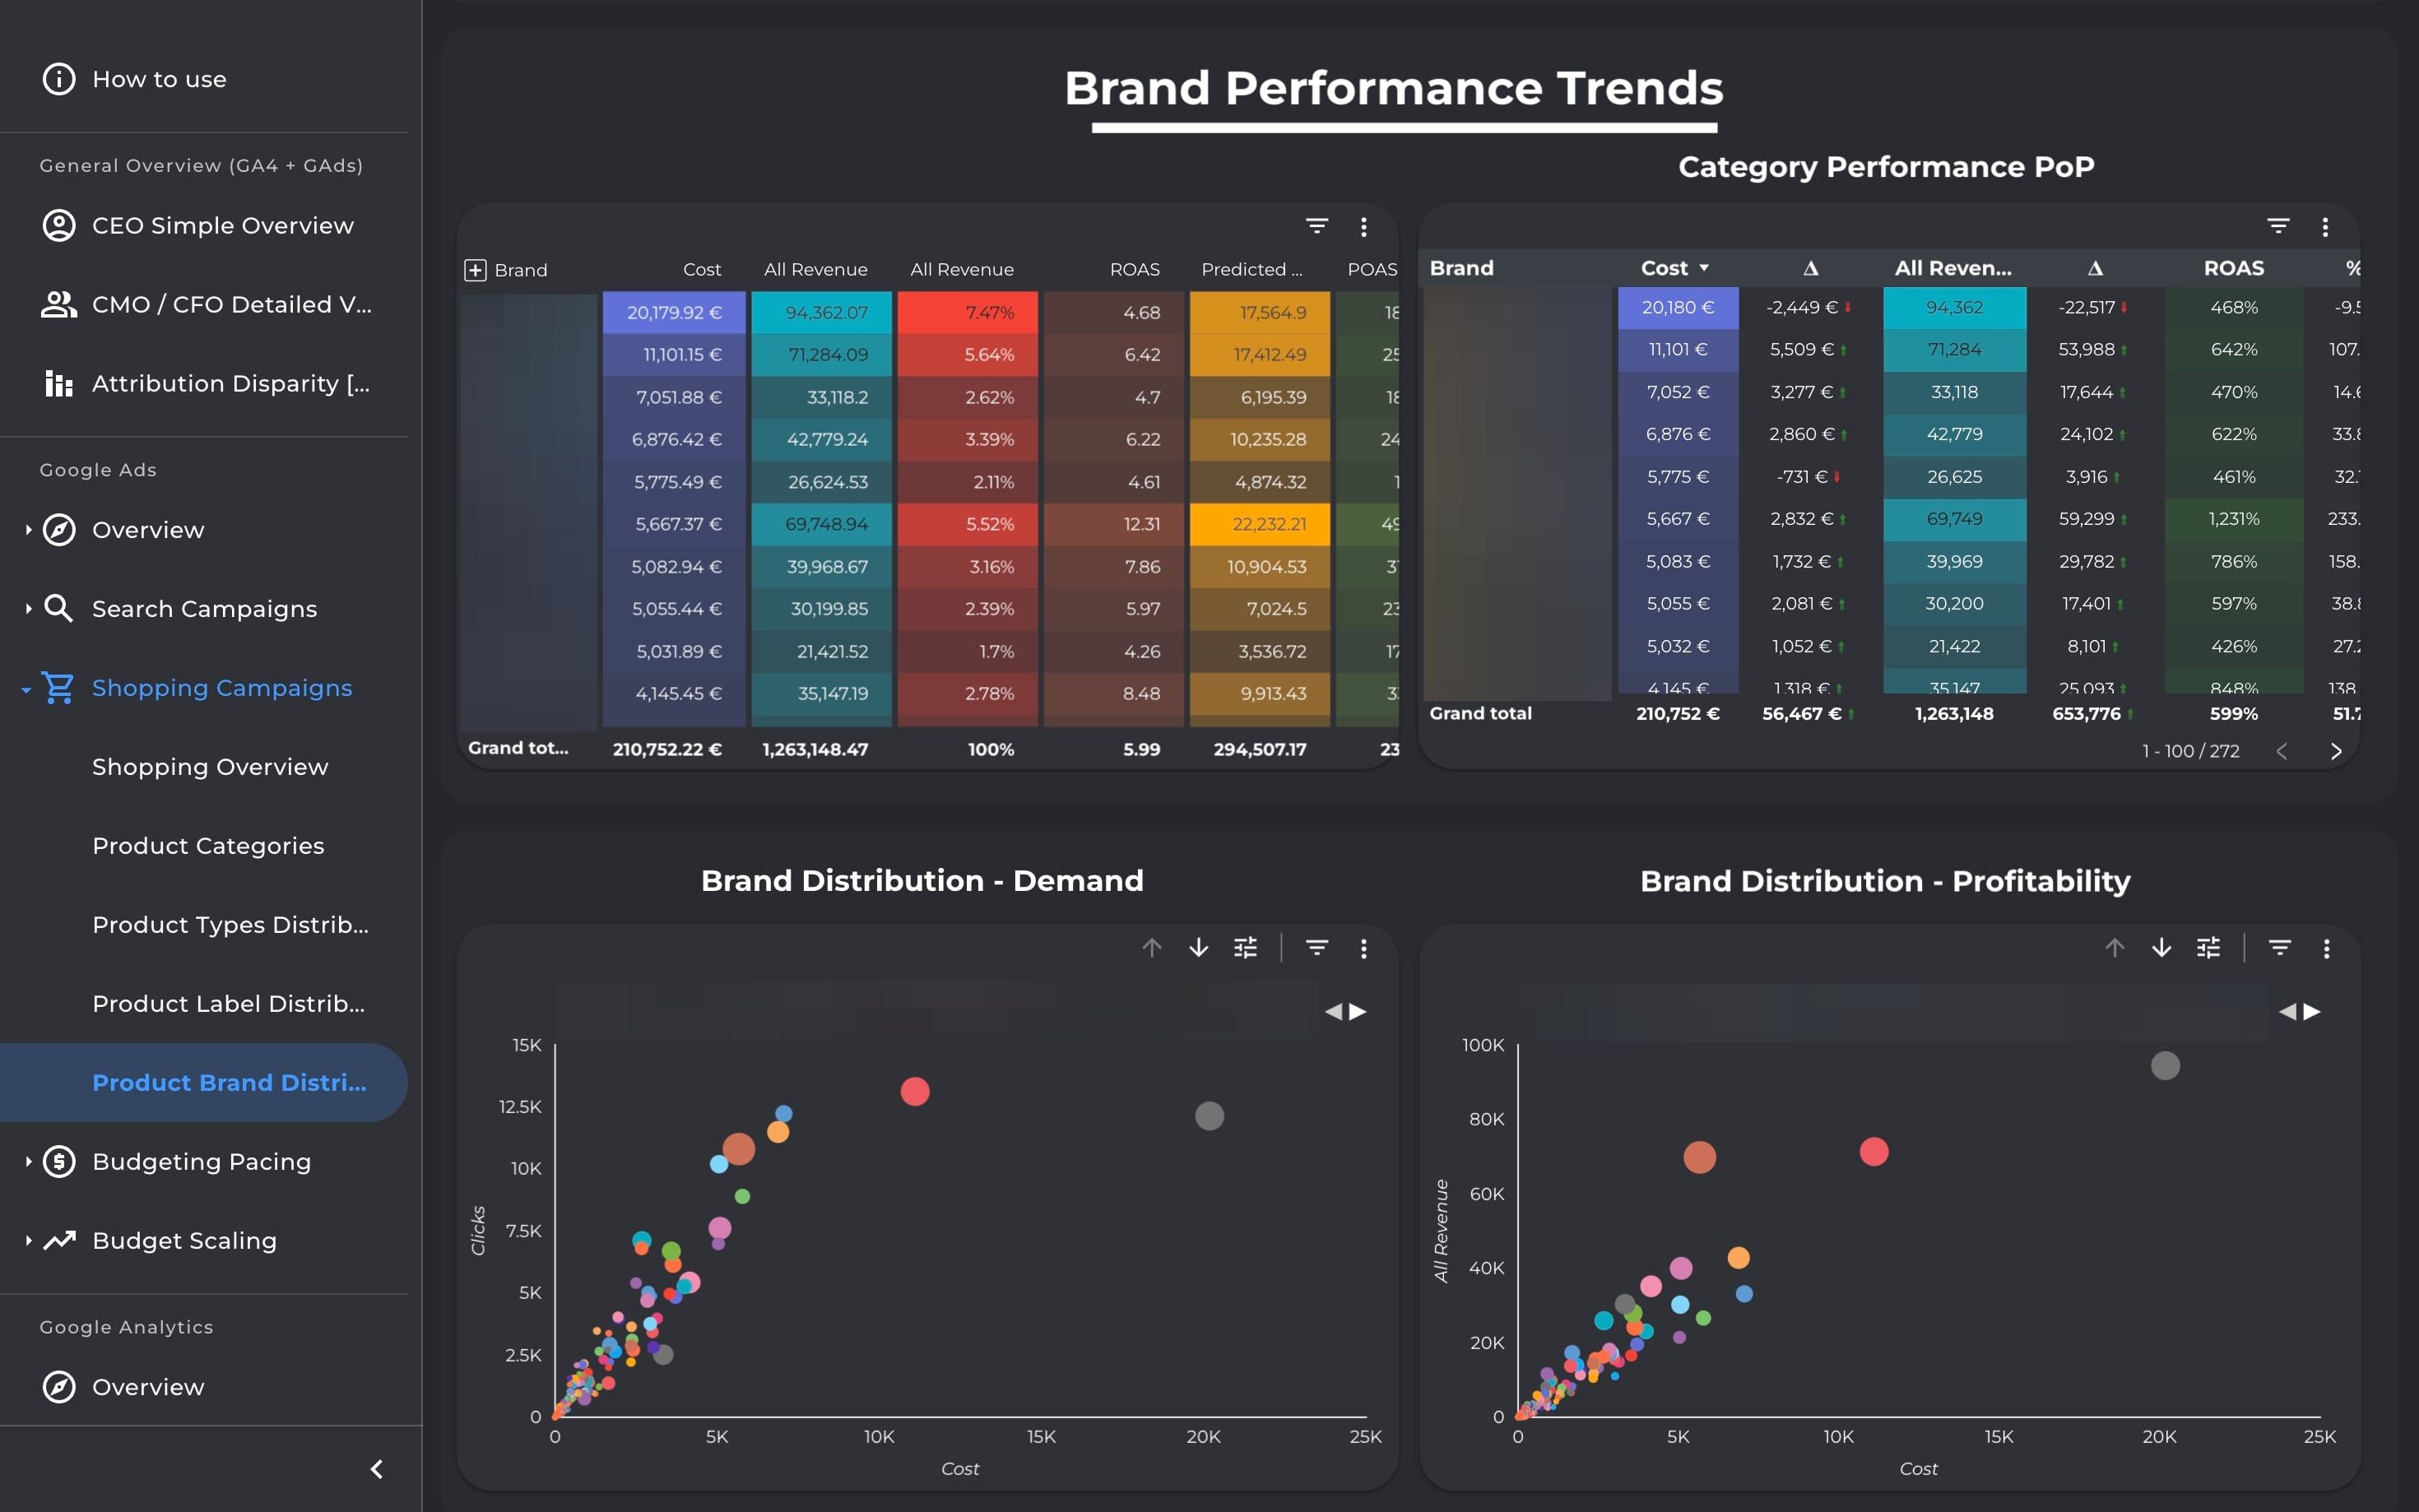
Analyze Shopping & PMax campaign profitability at product level. Drill into categories, brands, and labels to surface bestsellers, optimize structures, and align spend with scalable, high-margin products.
Analyze Shopping & PMax campaign profitability at product level. Drill into categories, brands, and labels to surface bestsellers, optimize structures, and align spend with scalable, high-margin products.
Analyze Shopping & PMax campaign profitability at product level. Drill into categories, brands, and labels to surface bestsellers, optimize structures, and align spend with scalable, high-margin products.
Analyze Shopping & PMax campaign profitability at product level. Drill into categories, brands, and labels to surface bestsellers, optimize structures, and align spend with scalable, high-margin products.