GA4 Item Lists & Promotions – Analyze Product Engagement
GA4 Item Lists & Promotions – Analyze Product Engagement
GA4 Item Lists & Promotions – Analyze Product Engagement
Understand how users interact with product listings, categories, and promotions to improve upsells and merchandising.
Understand how users interact with product listings, categories, and promotions to improve upsells and merchandising.
Understand how users interact with product listings, categories, and promotions to improve upsells and merchandising.
Highlights:
Item list CTR (click-through rate) across devices
Breakdown of item list performance: views, clicks, revenue
Device-level interaction insights (desktop, mobile, tablet)
List-level revenue attribution and engagement stats
Category-level breakdown by CTR and click volume
Item-level engagement metrics for deep dives
Dynamic switching between list name, position, and category
View promotion performance: views, clicks, gross item revenue
This report helps you measure and optimize how users interact with product lists and promotions on your eCommerce site or app. Based on GA4’s enhanced ecommerce tracking, it visualizes how often users view and click items across various lists—like category pages, search results, or promotional banners.
By monitoring item list click-through rates (CTR), gross item revenue, and device-level behavior, you can evaluate what drives engagement and where users drop off. The layout allows dynamic filtering by item list name, category, or position, making it easy to assess performance at any level of granularity.
You can also segment and monitor engagement by category levels (Category 1–5), understand which lists drive the highest revenue, and explore item-level trends to surface underperforming products or UX issues.
In addition to product listings, this dashboard includes built-in promotion tracking. By tagging site-wide promotions using GA4’s custom events, you can tie clicks, views, and purchases directly to your banners or offers, giving you a clear view of their impact.
Whether you’re focused on cross-sells, optimizing your merchandising, or analyzing layout performance, this report equips you with the data to make smarter engagement decisions.
Ideal for eCommerce analysts, product marketers, UX designers, and growth teams.
Other Master Dashboard Pages
Other Master Dashboard Pages
Check out all the pages included in the Master Bundle:
Check out all the pages included in the Master Bundle:
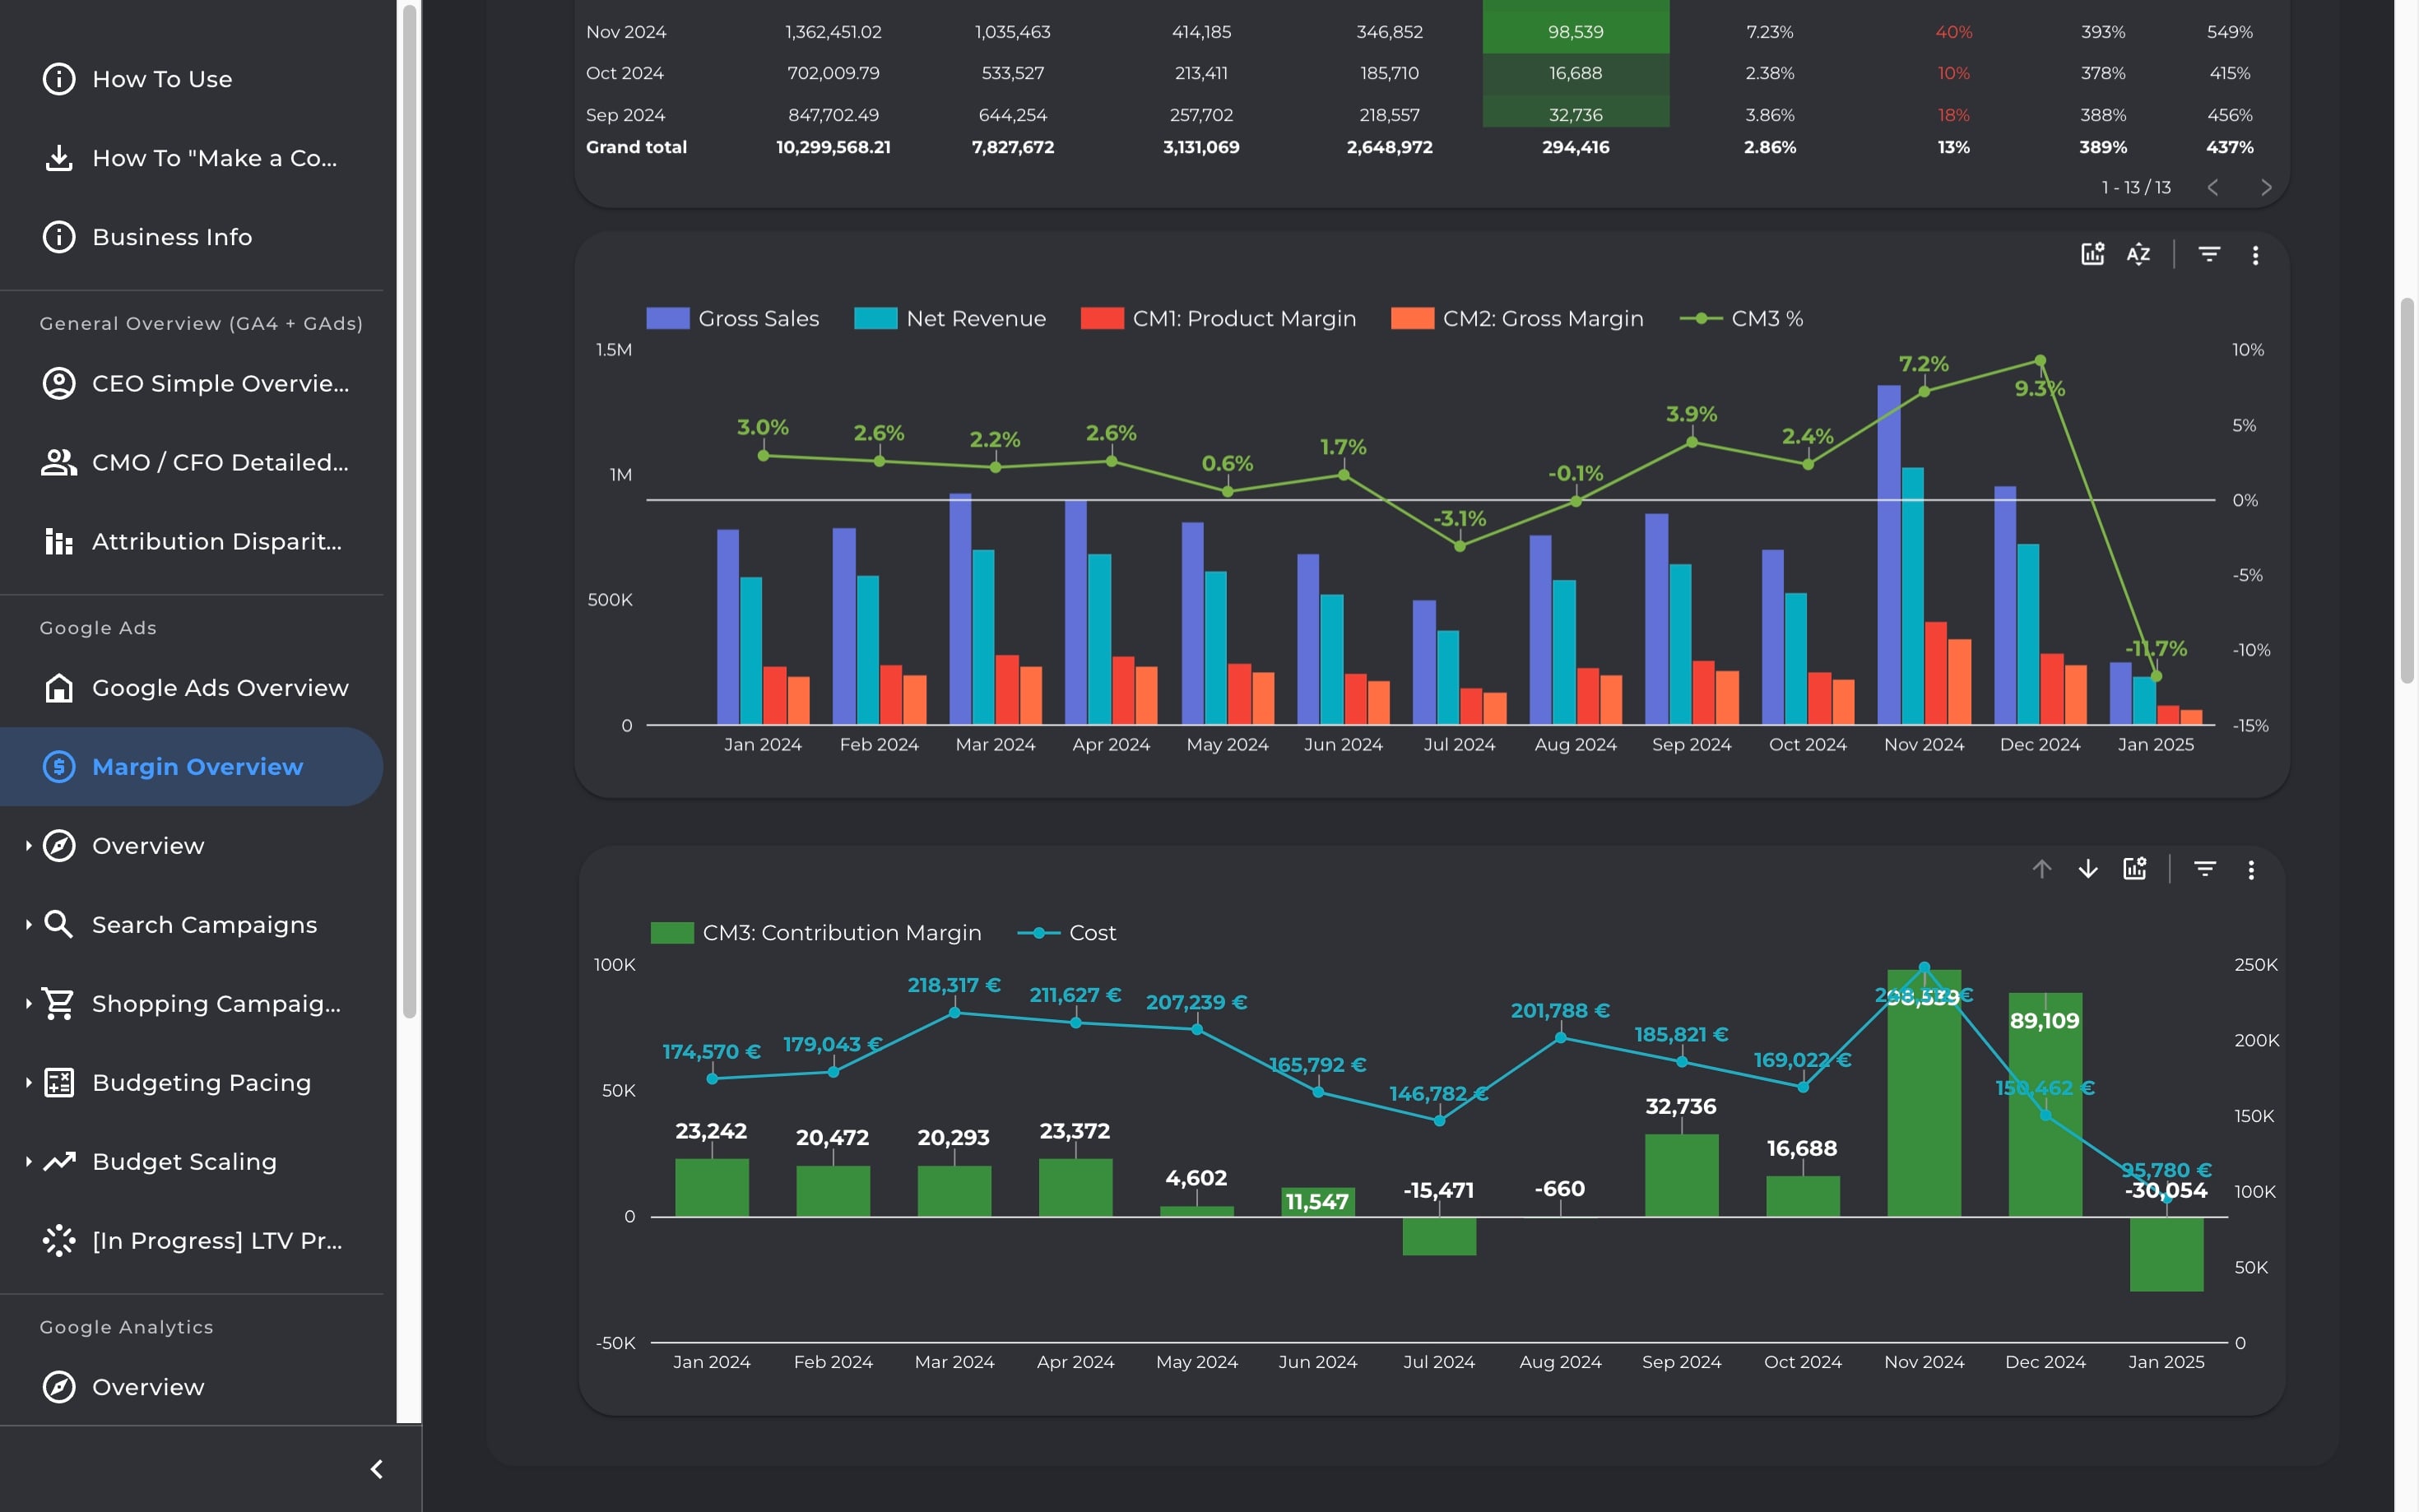
Visualize the full flow from sales to profit with a 3-tier margin breakdown. Estimate contribution margin and break-even ROAS to make smarter, finance-aligned marketing decisions.
Visualize the full flow from sales to profit with a 3-tier margin breakdown. Estimate contribution margin and break-even ROAS to make smarter, finance-aligned marketing decisions.
Visualize the full flow from sales to profit with a 3-tier margin breakdown. Estimate contribution margin and break-even ROAS to make smarter, finance-aligned marketing decisions.
Visualize the full flow from sales to profit with a 3-tier margin breakdown. Estimate contribution margin and break-even ROAS to make smarter, finance-aligned marketing decisions.
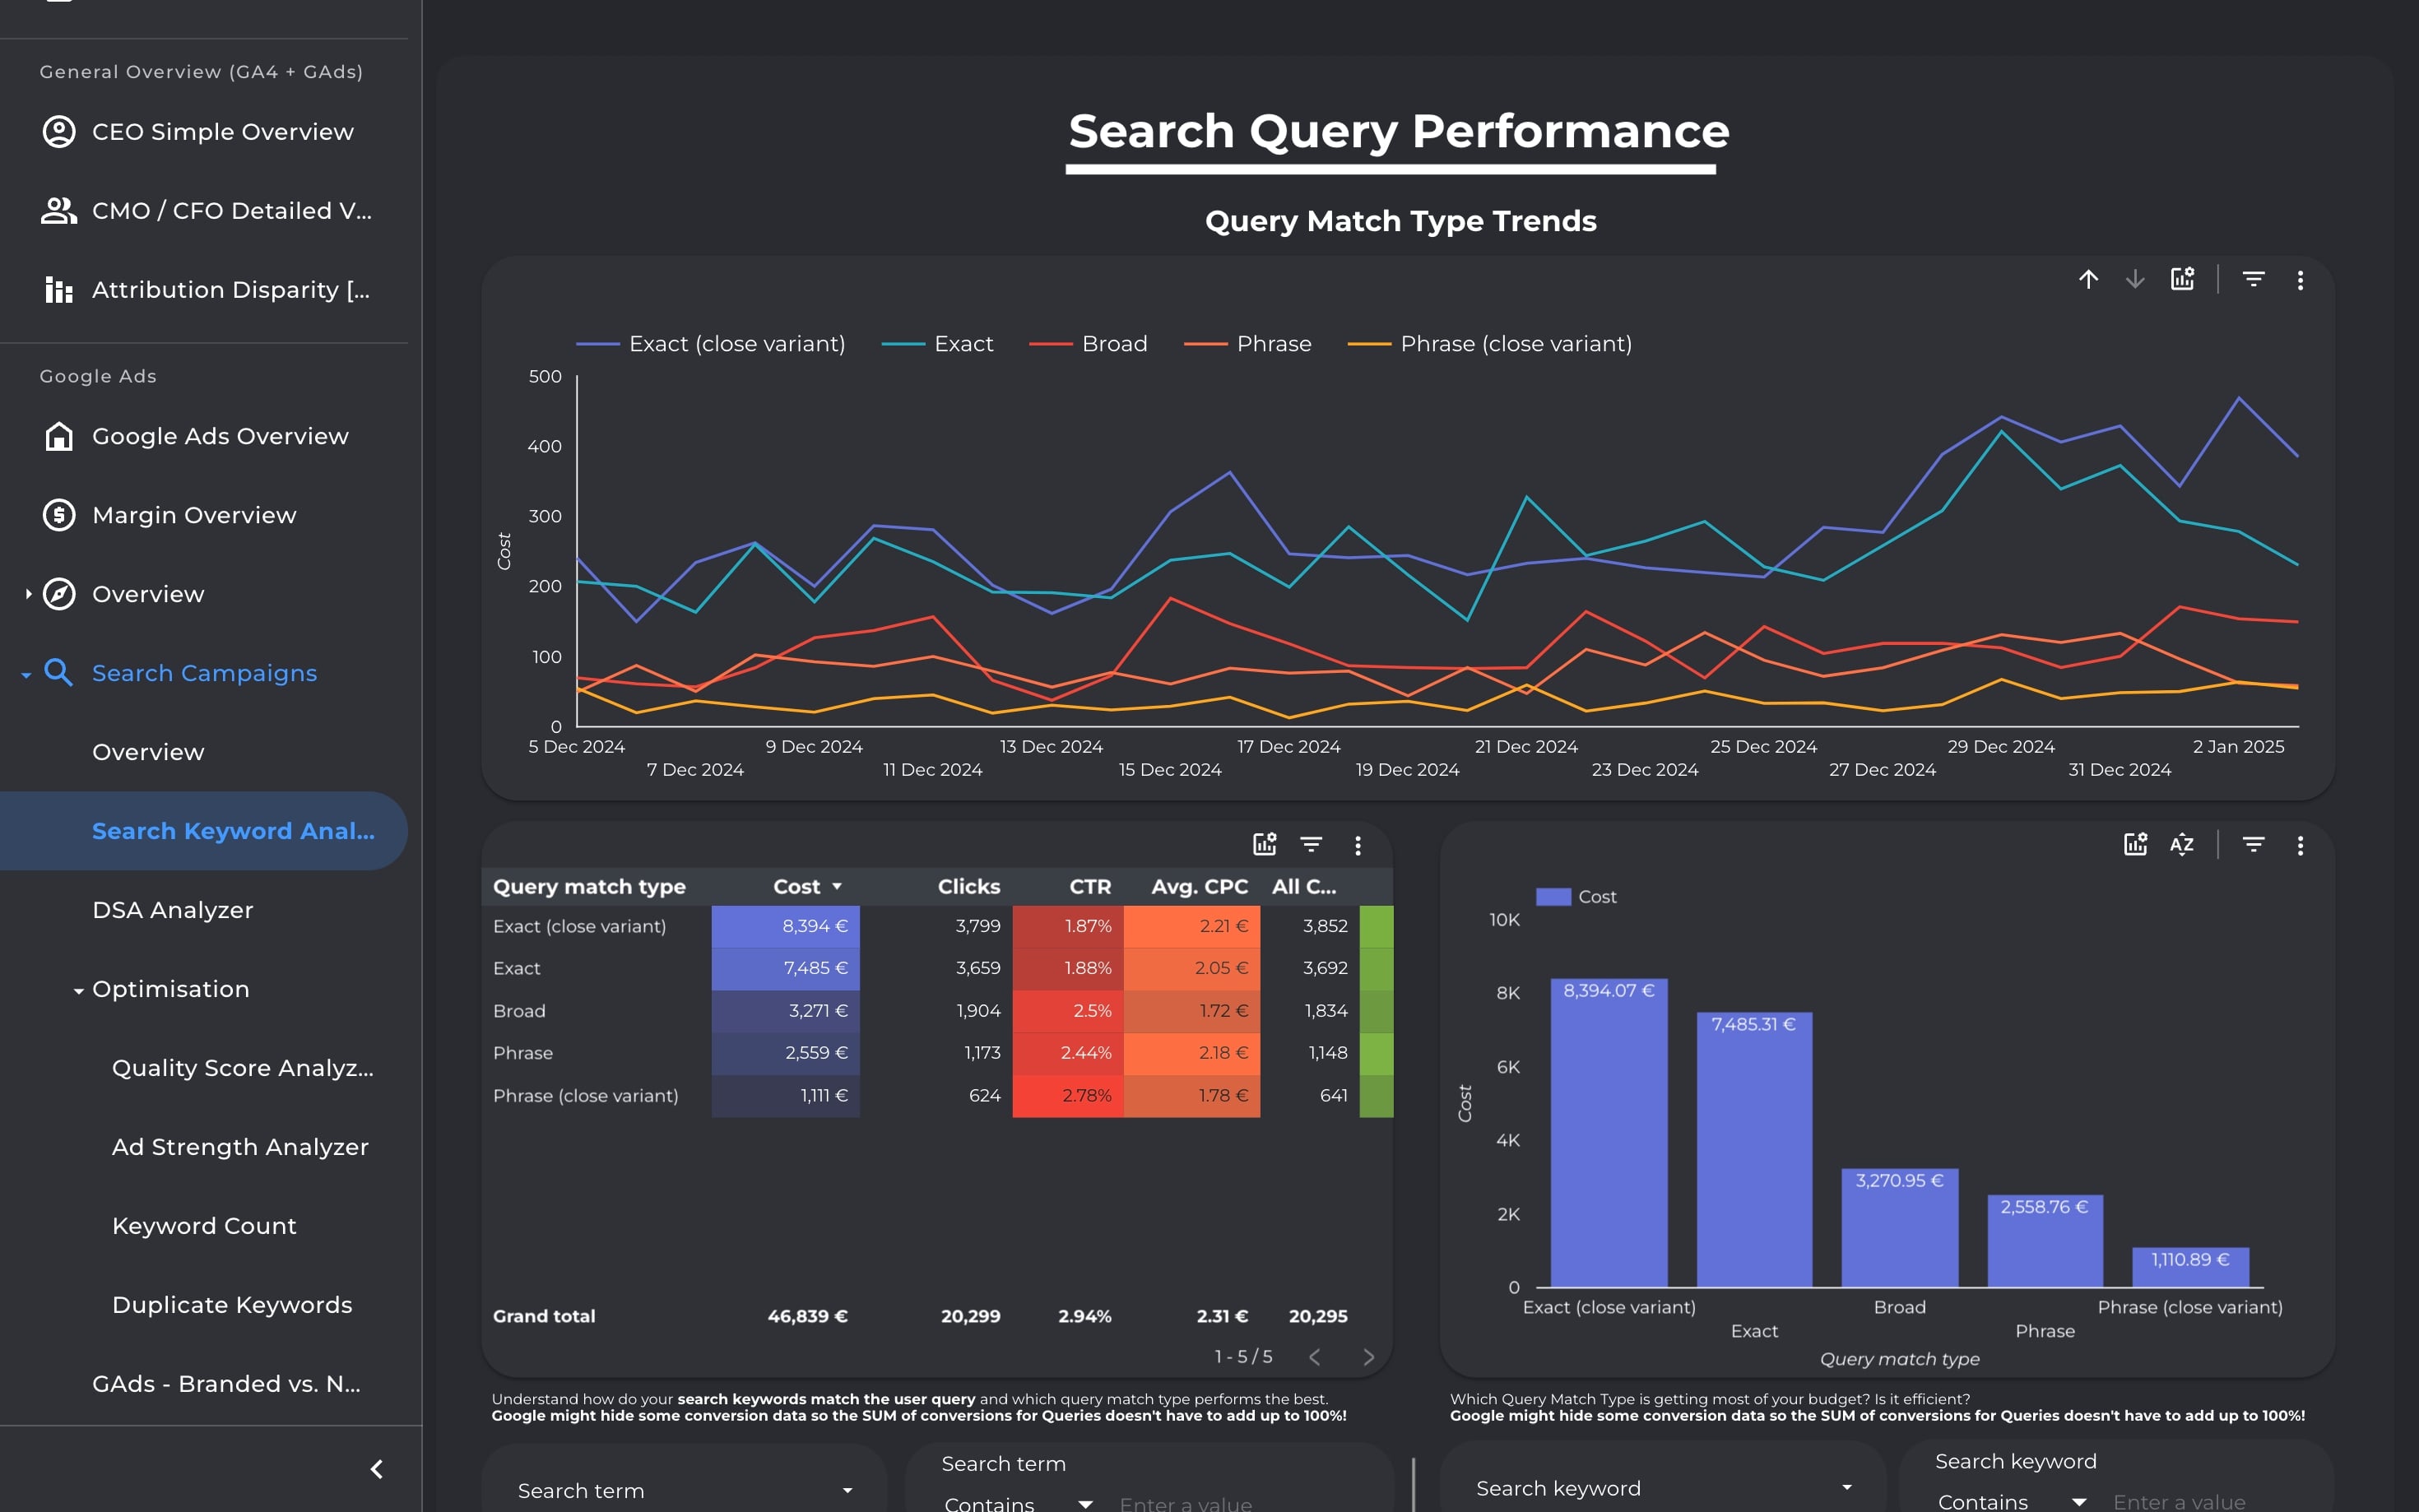
Diagnose and optimize your Search Ads campaigns from every angle—keywords, queries, match types, DSA, structure, and scoring. Identify waste, improve ROI, and simplify with data-backed decisions.
Diagnose and optimize your Search Ads campaigns from every angle—keywords, queries, match types, DSA, structure, and scoring. Identify waste, improve ROI, and simplify with data-backed decisions.
Diagnose and optimize your Search Ads campaigns from every angle—keywords, queries, match types, DSA, structure, and scoring. Identify waste, improve ROI, and simplify with data-backed decisions.
Diagnose and optimize your Search Ads campaigns from every angle—keywords, queries, match types, DSA, structure, and scoring. Identify waste, improve ROI, and simplify with data-backed decisions.
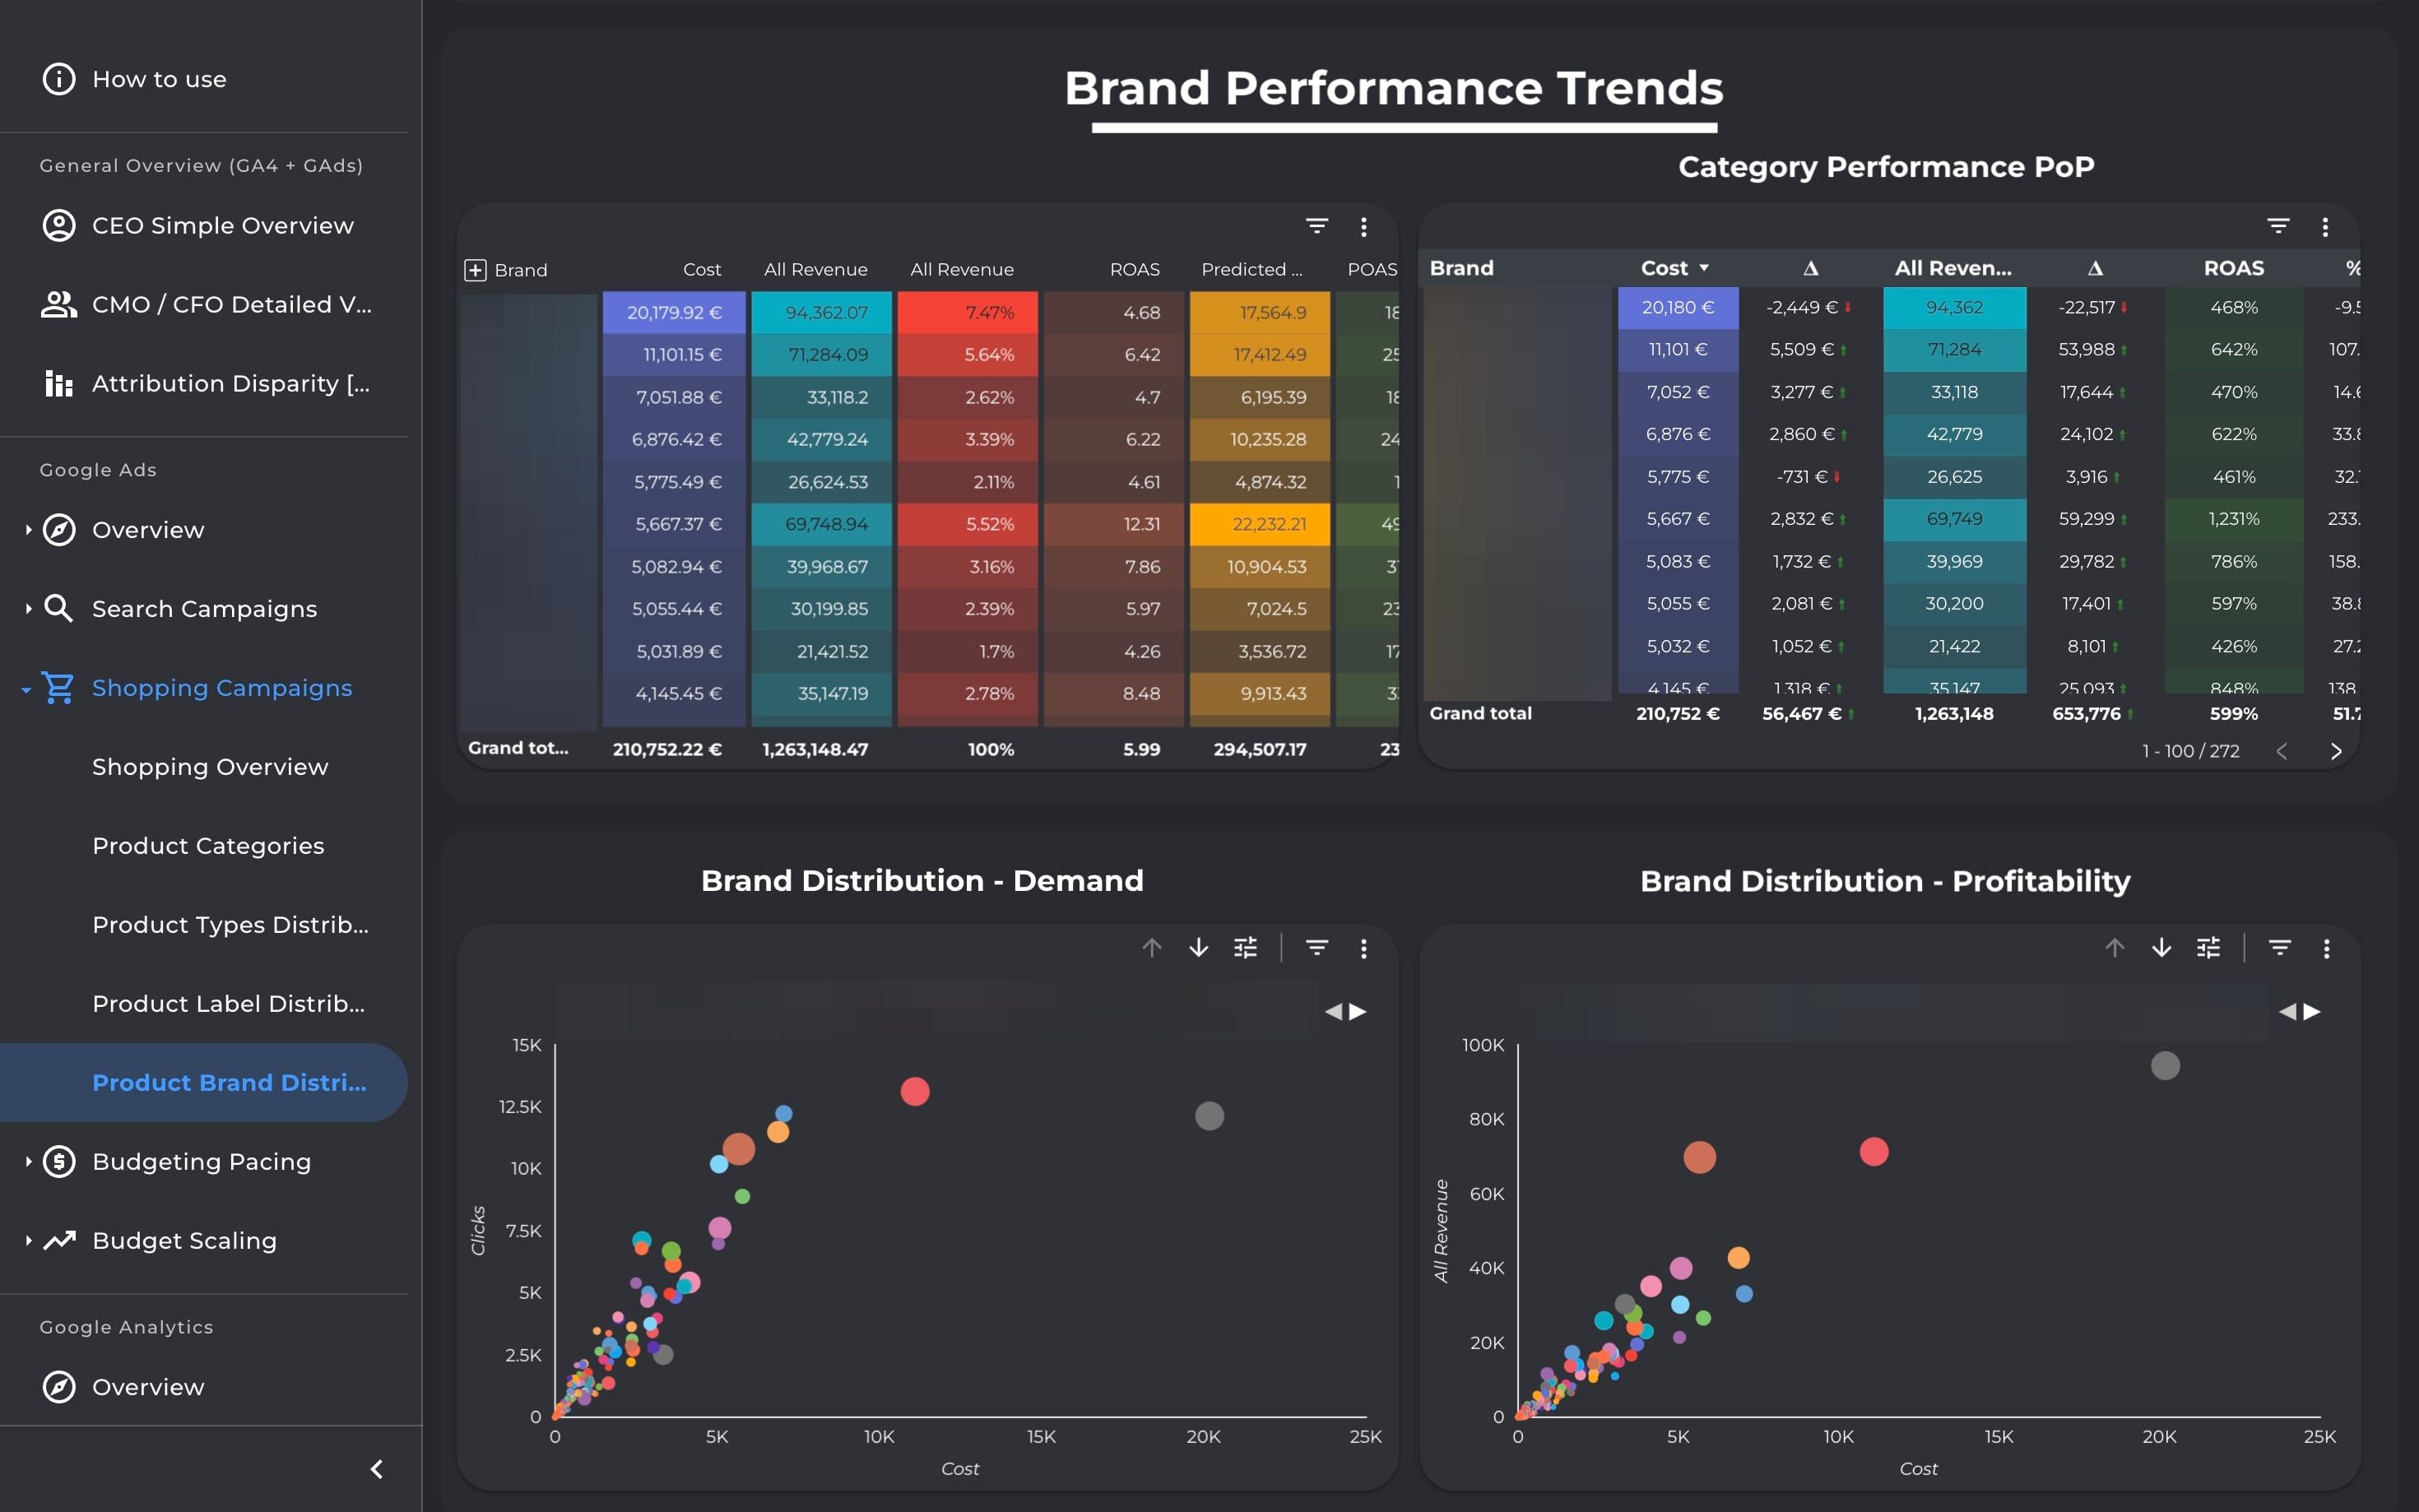
Analyze Shopping & PMax campaign profitability at product level. Drill into categories, brands, and labels to surface bestsellers, optimize structures, and align spend with scalable, high-margin products.
Analyze Shopping & PMax campaign profitability at product level. Drill into categories, brands, and labels to surface bestsellers, optimize structures, and align spend with scalable, high-margin products.
Analyze Shopping & PMax campaign profitability at product level. Drill into categories, brands, and labels to surface bestsellers, optimize structures, and align spend with scalable, high-margin products.
Analyze Shopping & PMax campaign profitability at product level. Drill into categories, brands, and labels to surface bestsellers, optimize structures, and align spend with scalable, high-margin products.