GA4 Funnel Optimization – Purchase Journey Insights
GA4 Funnel Optimization – Purchase Journey Insights
GA4 Funnel Optimization – Purchase Journey Insights
Track each step of your customer journey to uncover funnel drop-offs and improve conversion rates.
Track each step of your customer journey to uncover funnel drop-offs and improve conversion rates.
Track each step of your customer journey to uncover funnel drop-offs and improve conversion rates.
Highlights:
Funnel steps: sessions → item views → cart → checkout → purchase
Drop-off rate visibility for cart and checkout steps
Conversion rate trends over time (CR%, Checkout CR%, Purchase CR%)
Channel-specific performance across funnel stages
Seasonal and campaign-based CR% tracking
Fully cross-filtered by channel or source/medium
The GA4 Customer Journey report helps you visualize and optimize every stage of the eCommerce funnel from the moment a user visits your website until they complete a transaction.
By mapping out each funnel stage (Sessions, Item Views, Add to Cart, Checkout, Purchase), you can pinpoint where users drop off. If cart or checkout conversion rates are low, this report will help you dig into potential issues such as:
Product pricing
Checkout UX friction
Technical bugs or site speed
You’ll also be able to compare performance across marketing channels to identify campaigns that drive traffic but fail to convert. Use this data to refine targeting, creatives, or bidding strategies.
The dynamic line charts show Conversion Rate changes over time, making it easy to evaluate the effectiveness of optimizations, discounts, or seasonal promotions.
Thanks to cross-filtered functionality, you can instantly isolate trends for a single source/medium or campaign by simply clicking on it—no manual filtering needed.
Perfect for CRO specialists, growth marketers, and eCommerce managers looking to improve funnel efficiency and drive more conversions.
Other Master Dashboard Pages
Other Master Dashboard Pages
Check out all the pages included in the Master Bundle:
Check out all the pages included in the Master Bundle:
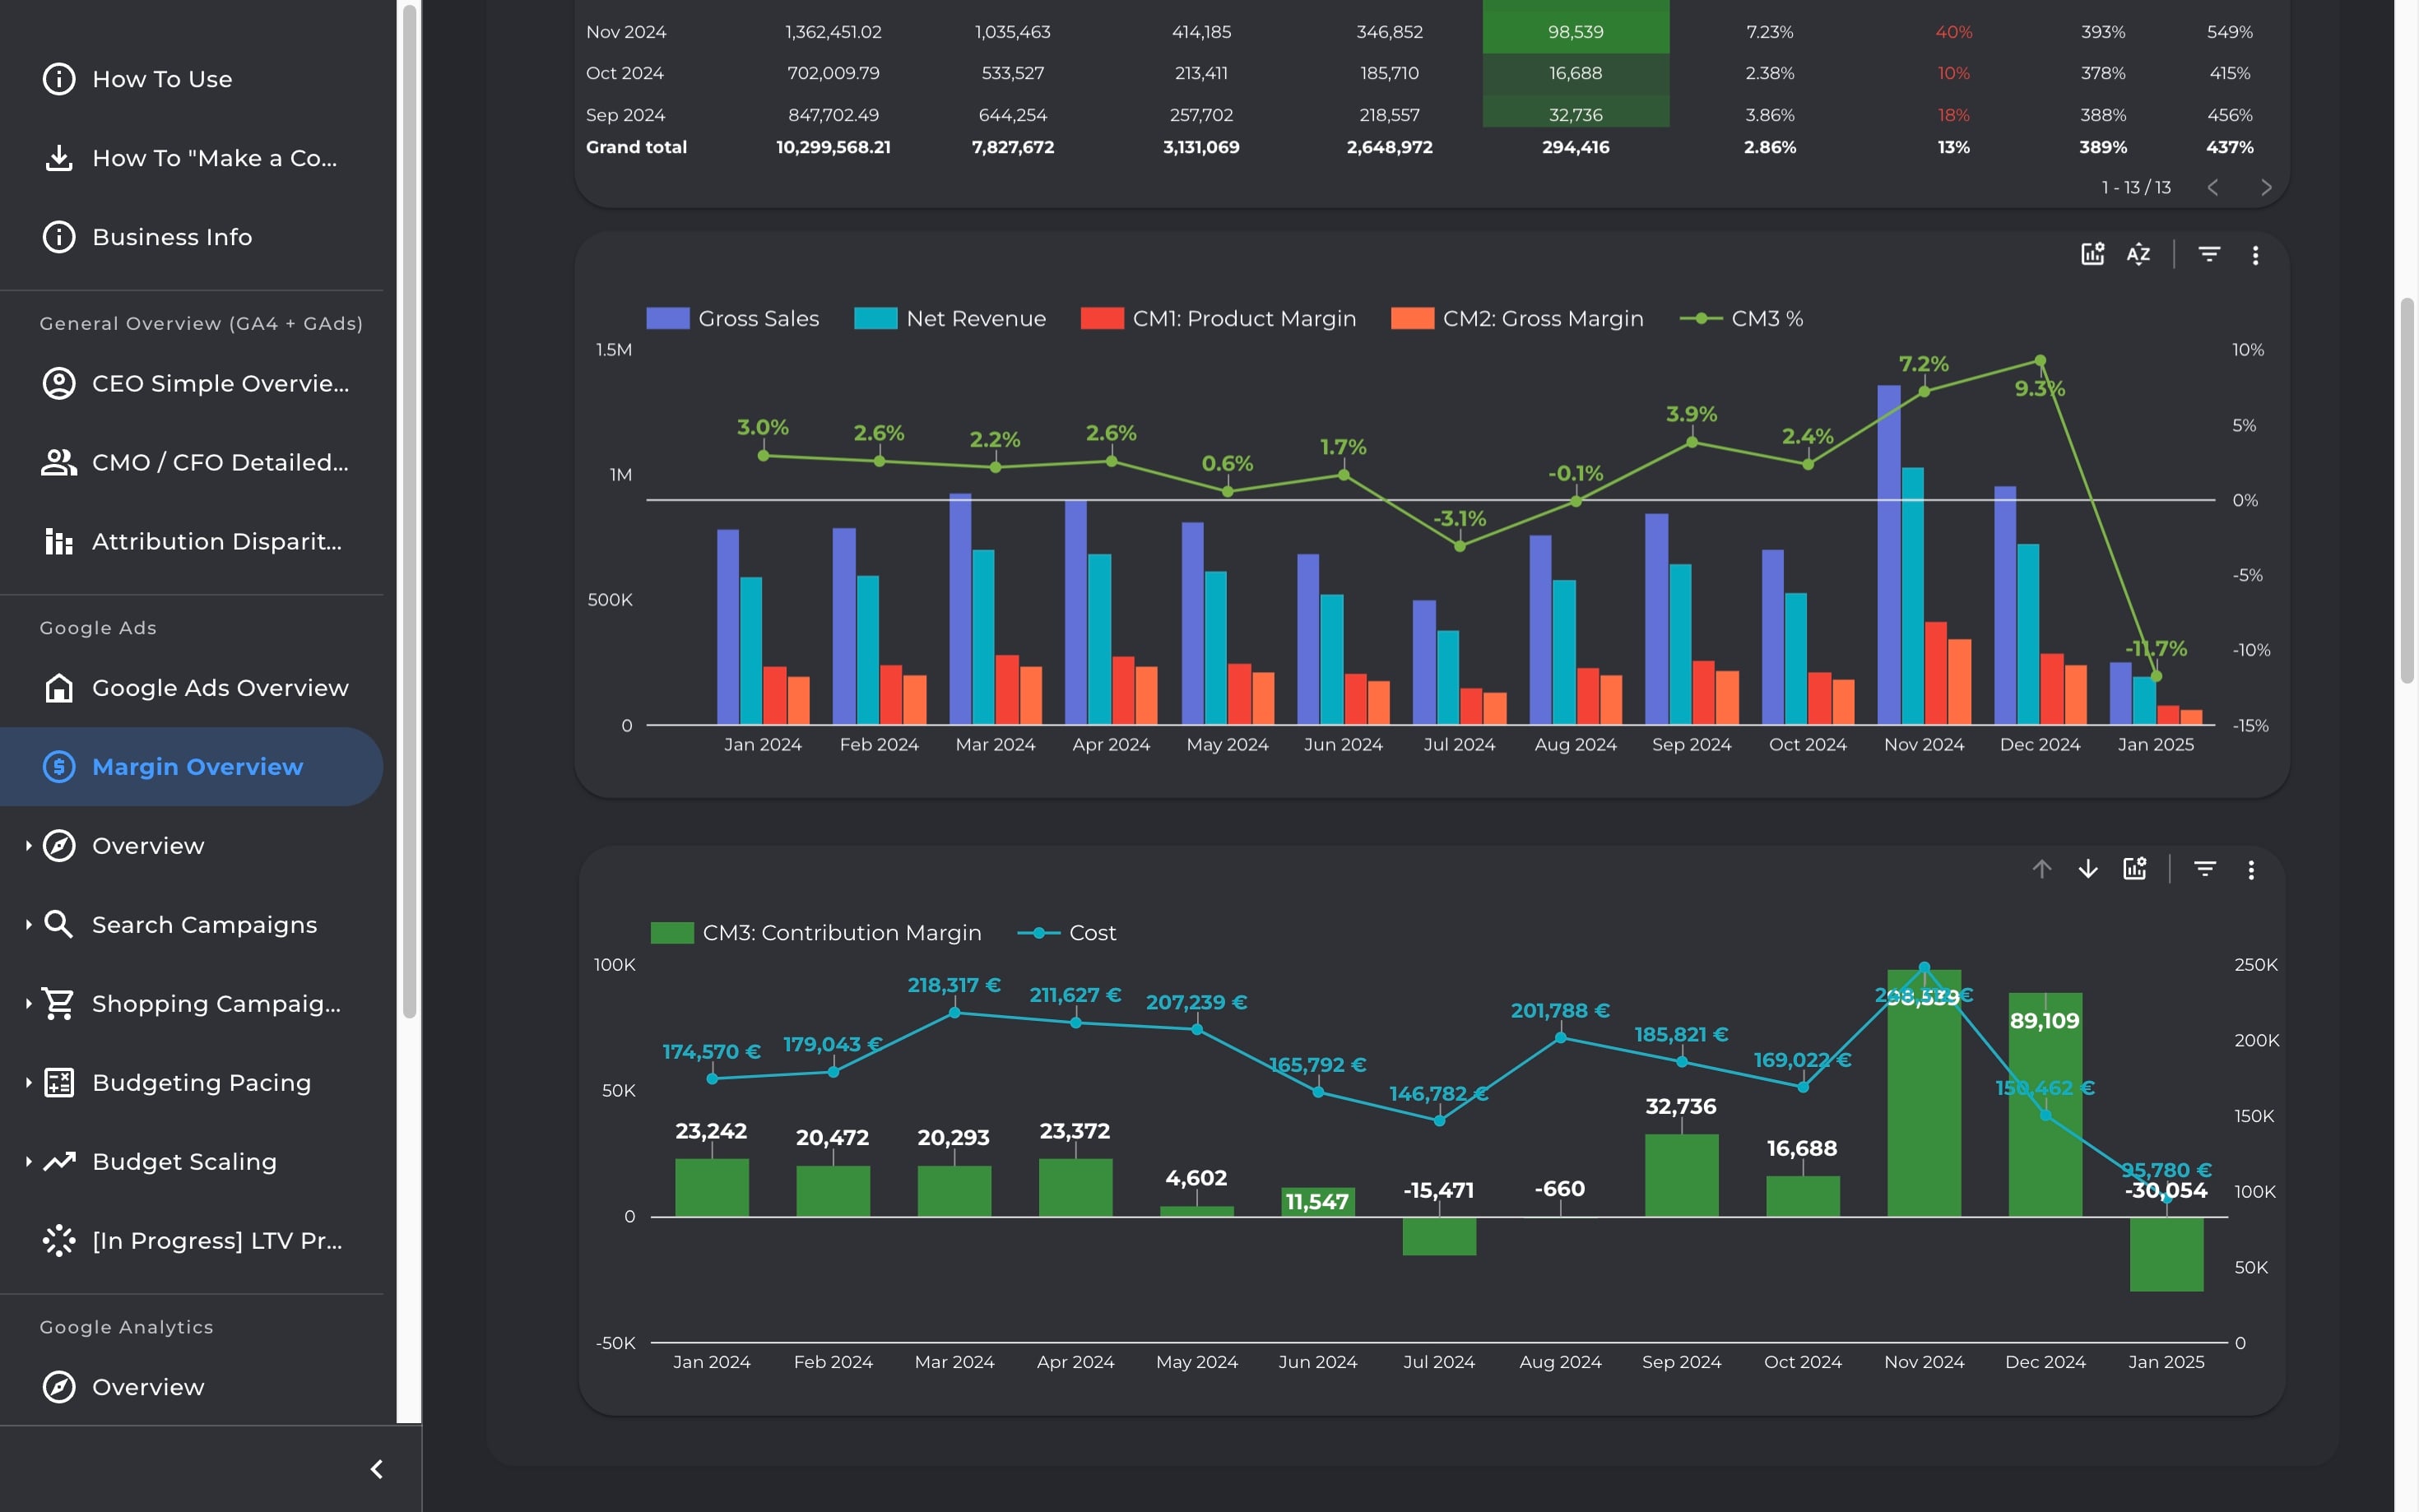
Visualize the full flow from sales to profit with a 3-tier margin breakdown. Estimate contribution margin and break-even ROAS to make smarter, finance-aligned marketing decisions.
Visualize the full flow from sales to profit with a 3-tier margin breakdown. Estimate contribution margin and break-even ROAS to make smarter, finance-aligned marketing decisions.
Visualize the full flow from sales to profit with a 3-tier margin breakdown. Estimate contribution margin and break-even ROAS to make smarter, finance-aligned marketing decisions.
Visualize the full flow from sales to profit with a 3-tier margin breakdown. Estimate contribution margin and break-even ROAS to make smarter, finance-aligned marketing decisions.
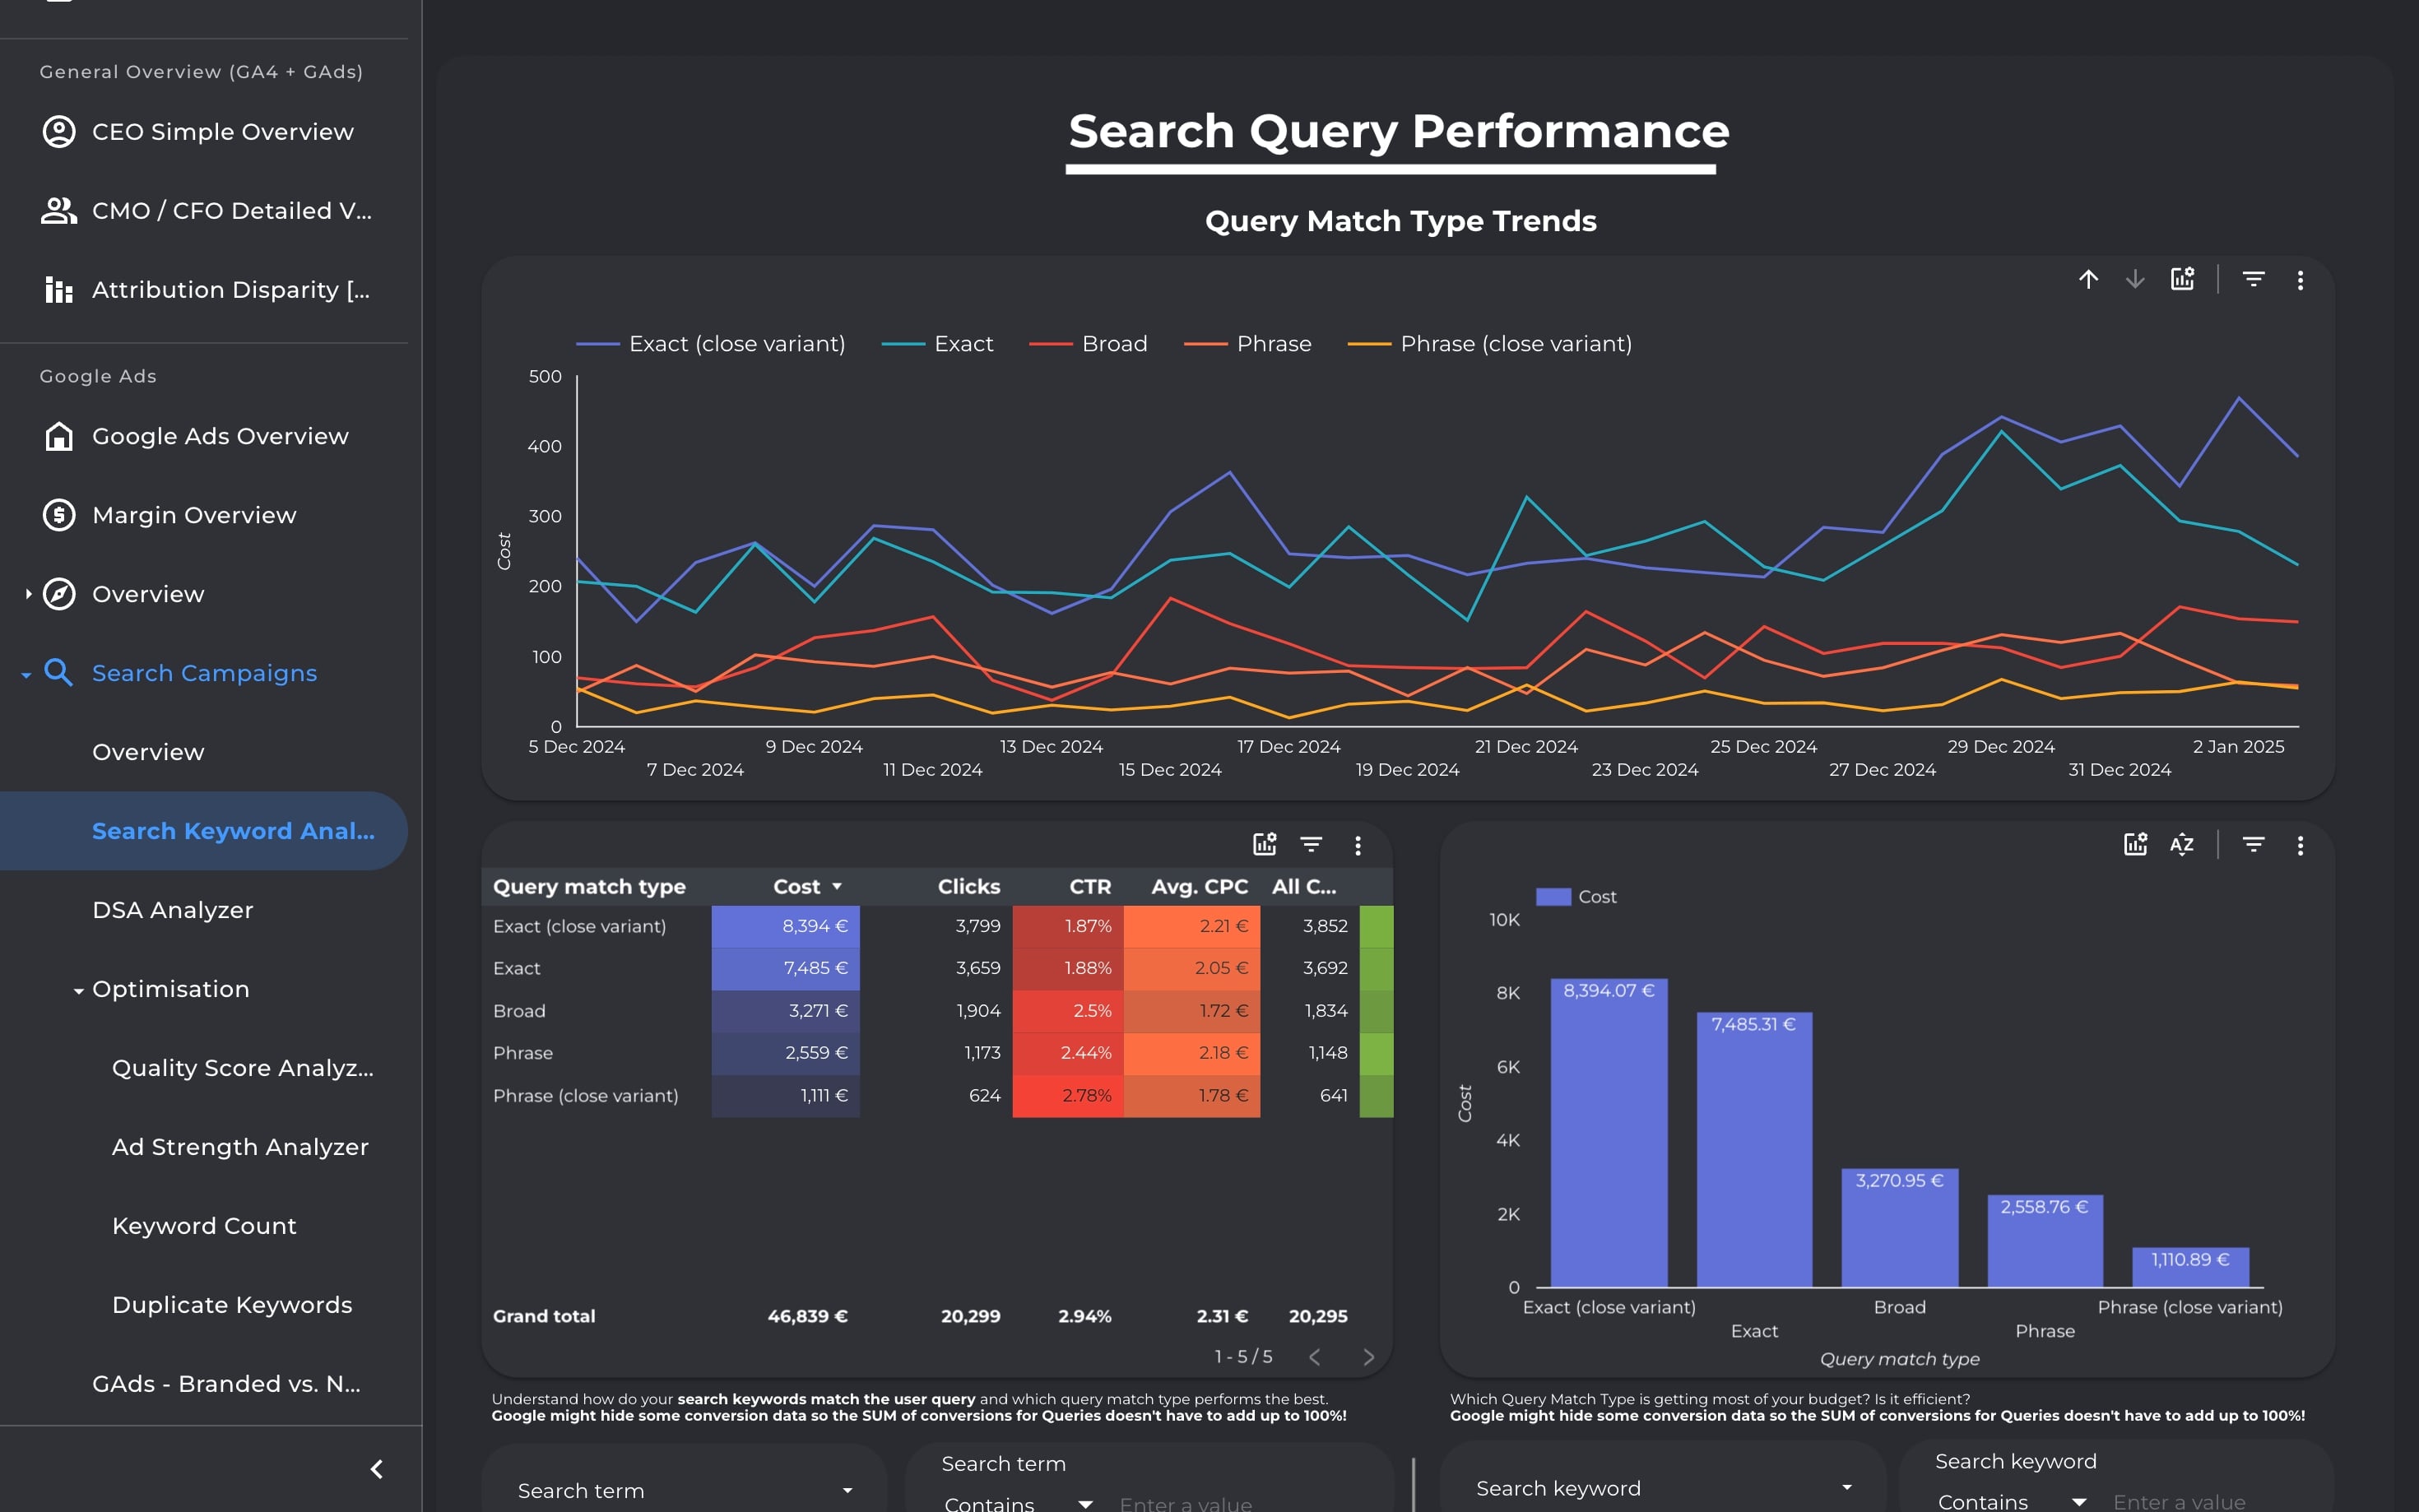
Diagnose and optimize your Search Ads campaigns from every angle—keywords, queries, match types, DSA, structure, and scoring. Identify waste, improve ROI, and simplify with data-backed decisions.
Diagnose and optimize your Search Ads campaigns from every angle—keywords, queries, match types, DSA, structure, and scoring. Identify waste, improve ROI, and simplify with data-backed decisions.
Diagnose and optimize your Search Ads campaigns from every angle—keywords, queries, match types, DSA, structure, and scoring. Identify waste, improve ROI, and simplify with data-backed decisions.
Diagnose and optimize your Search Ads campaigns from every angle—keywords, queries, match types, DSA, structure, and scoring. Identify waste, improve ROI, and simplify with data-backed decisions.
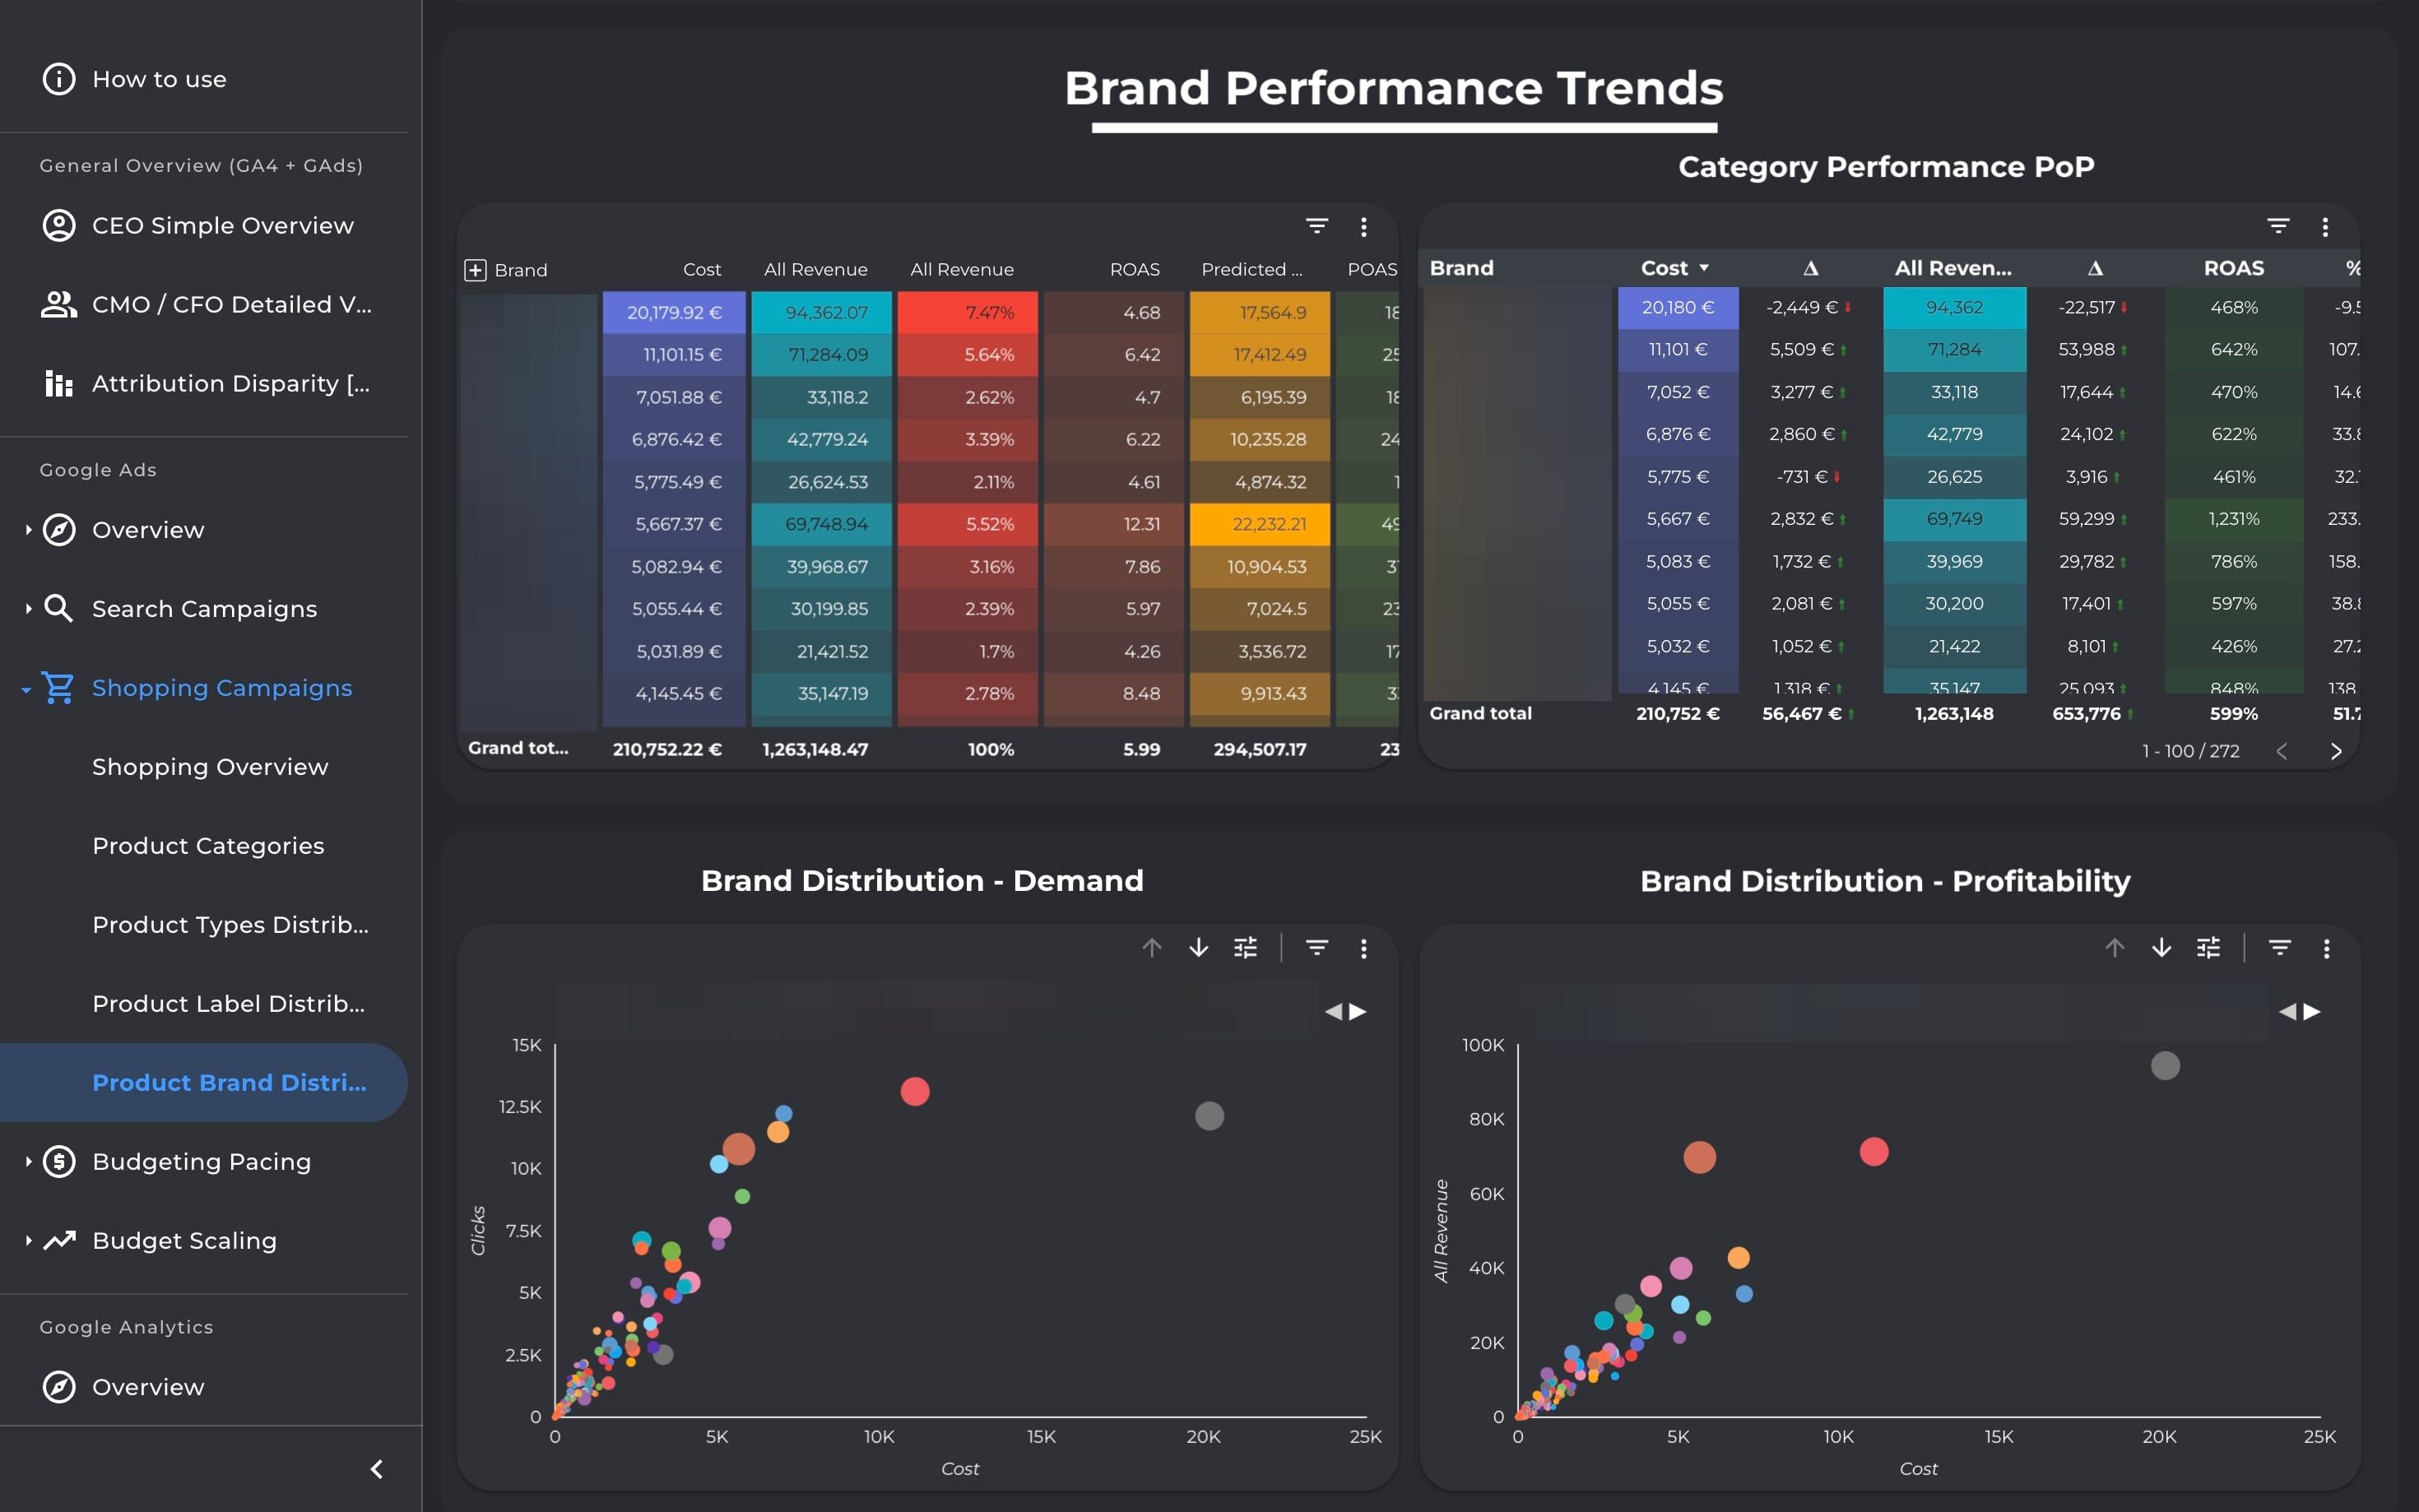
Analyze Shopping & PMax campaign profitability at product level. Drill into categories, brands, and labels to surface bestsellers, optimize structures, and align spend with scalable, high-margin products.
Analyze Shopping & PMax campaign profitability at product level. Drill into categories, brands, and labels to surface bestsellers, optimize structures, and align spend with scalable, high-margin products.
Analyze Shopping & PMax campaign profitability at product level. Drill into categories, brands, and labels to surface bestsellers, optimize structures, and align spend with scalable, high-margin products.
Analyze Shopping & PMax campaign profitability at product level. Drill into categories, brands, and labels to surface bestsellers, optimize structures, and align spend with scalable, high-margin products.