GA4 Understand Category, Brand, and Delivery Insights
GA4 Understand Category, Brand, and Delivery Insights
GA4 Understand Category, Brand, and Delivery Insights
Analyze product-level performance by category, brand, and shipping efficiency.
Analyze product-level performance by category, brand, and shipping efficiency.
Analyze product-level performance by category, brand, and shipping efficiency.
Highlights:
Breakdown of GA4 product data by 5 category levels
Item-level metrics: revenue, sessions, purchases, and refunds
Visualized category trends over time
Brand performance by views, add-to-cart, checkout, and revenue
Brand profitability and revenue share analysis
Delivery cost and “Delivery per Purchase” trends
Performance segmented by shipping tier
This report gives you a full product-level performance overview, using Google Analytics 4 eCommerce data.
You’ll be able to explore how different product categories and brands contribute to revenue, traffic, and conversions - plus assess logistics costs when delivery tracking is set up.
Start by reviewing session, purchase, and refund data broken down by item category levels 1–5. This allows you to track category trends over time and detect seasonal shifts or underperforming segments.
Move into the brand view to see how specific product lines are performing in terms of item views, cart additions, checkouts, and final purchases.
Identify where revenue is concentrated and whether you may be over-reliant on a small subset of brands. Use this to rebalance spend or boost visibility for high-margin, low-volume brands.
Lastly, if you import delivery data into GA4, analyze cost-per-purchase trends and evaluate shipping tier performance. Find out which shipping methods are cost-efficient and which ones might be cutting into your profit margin.
Other Master Dashboard Pages
Other Master Dashboard Pages
Check out all the pages included in the Master Bundle:
Check out all the pages included in the Master Bundle:
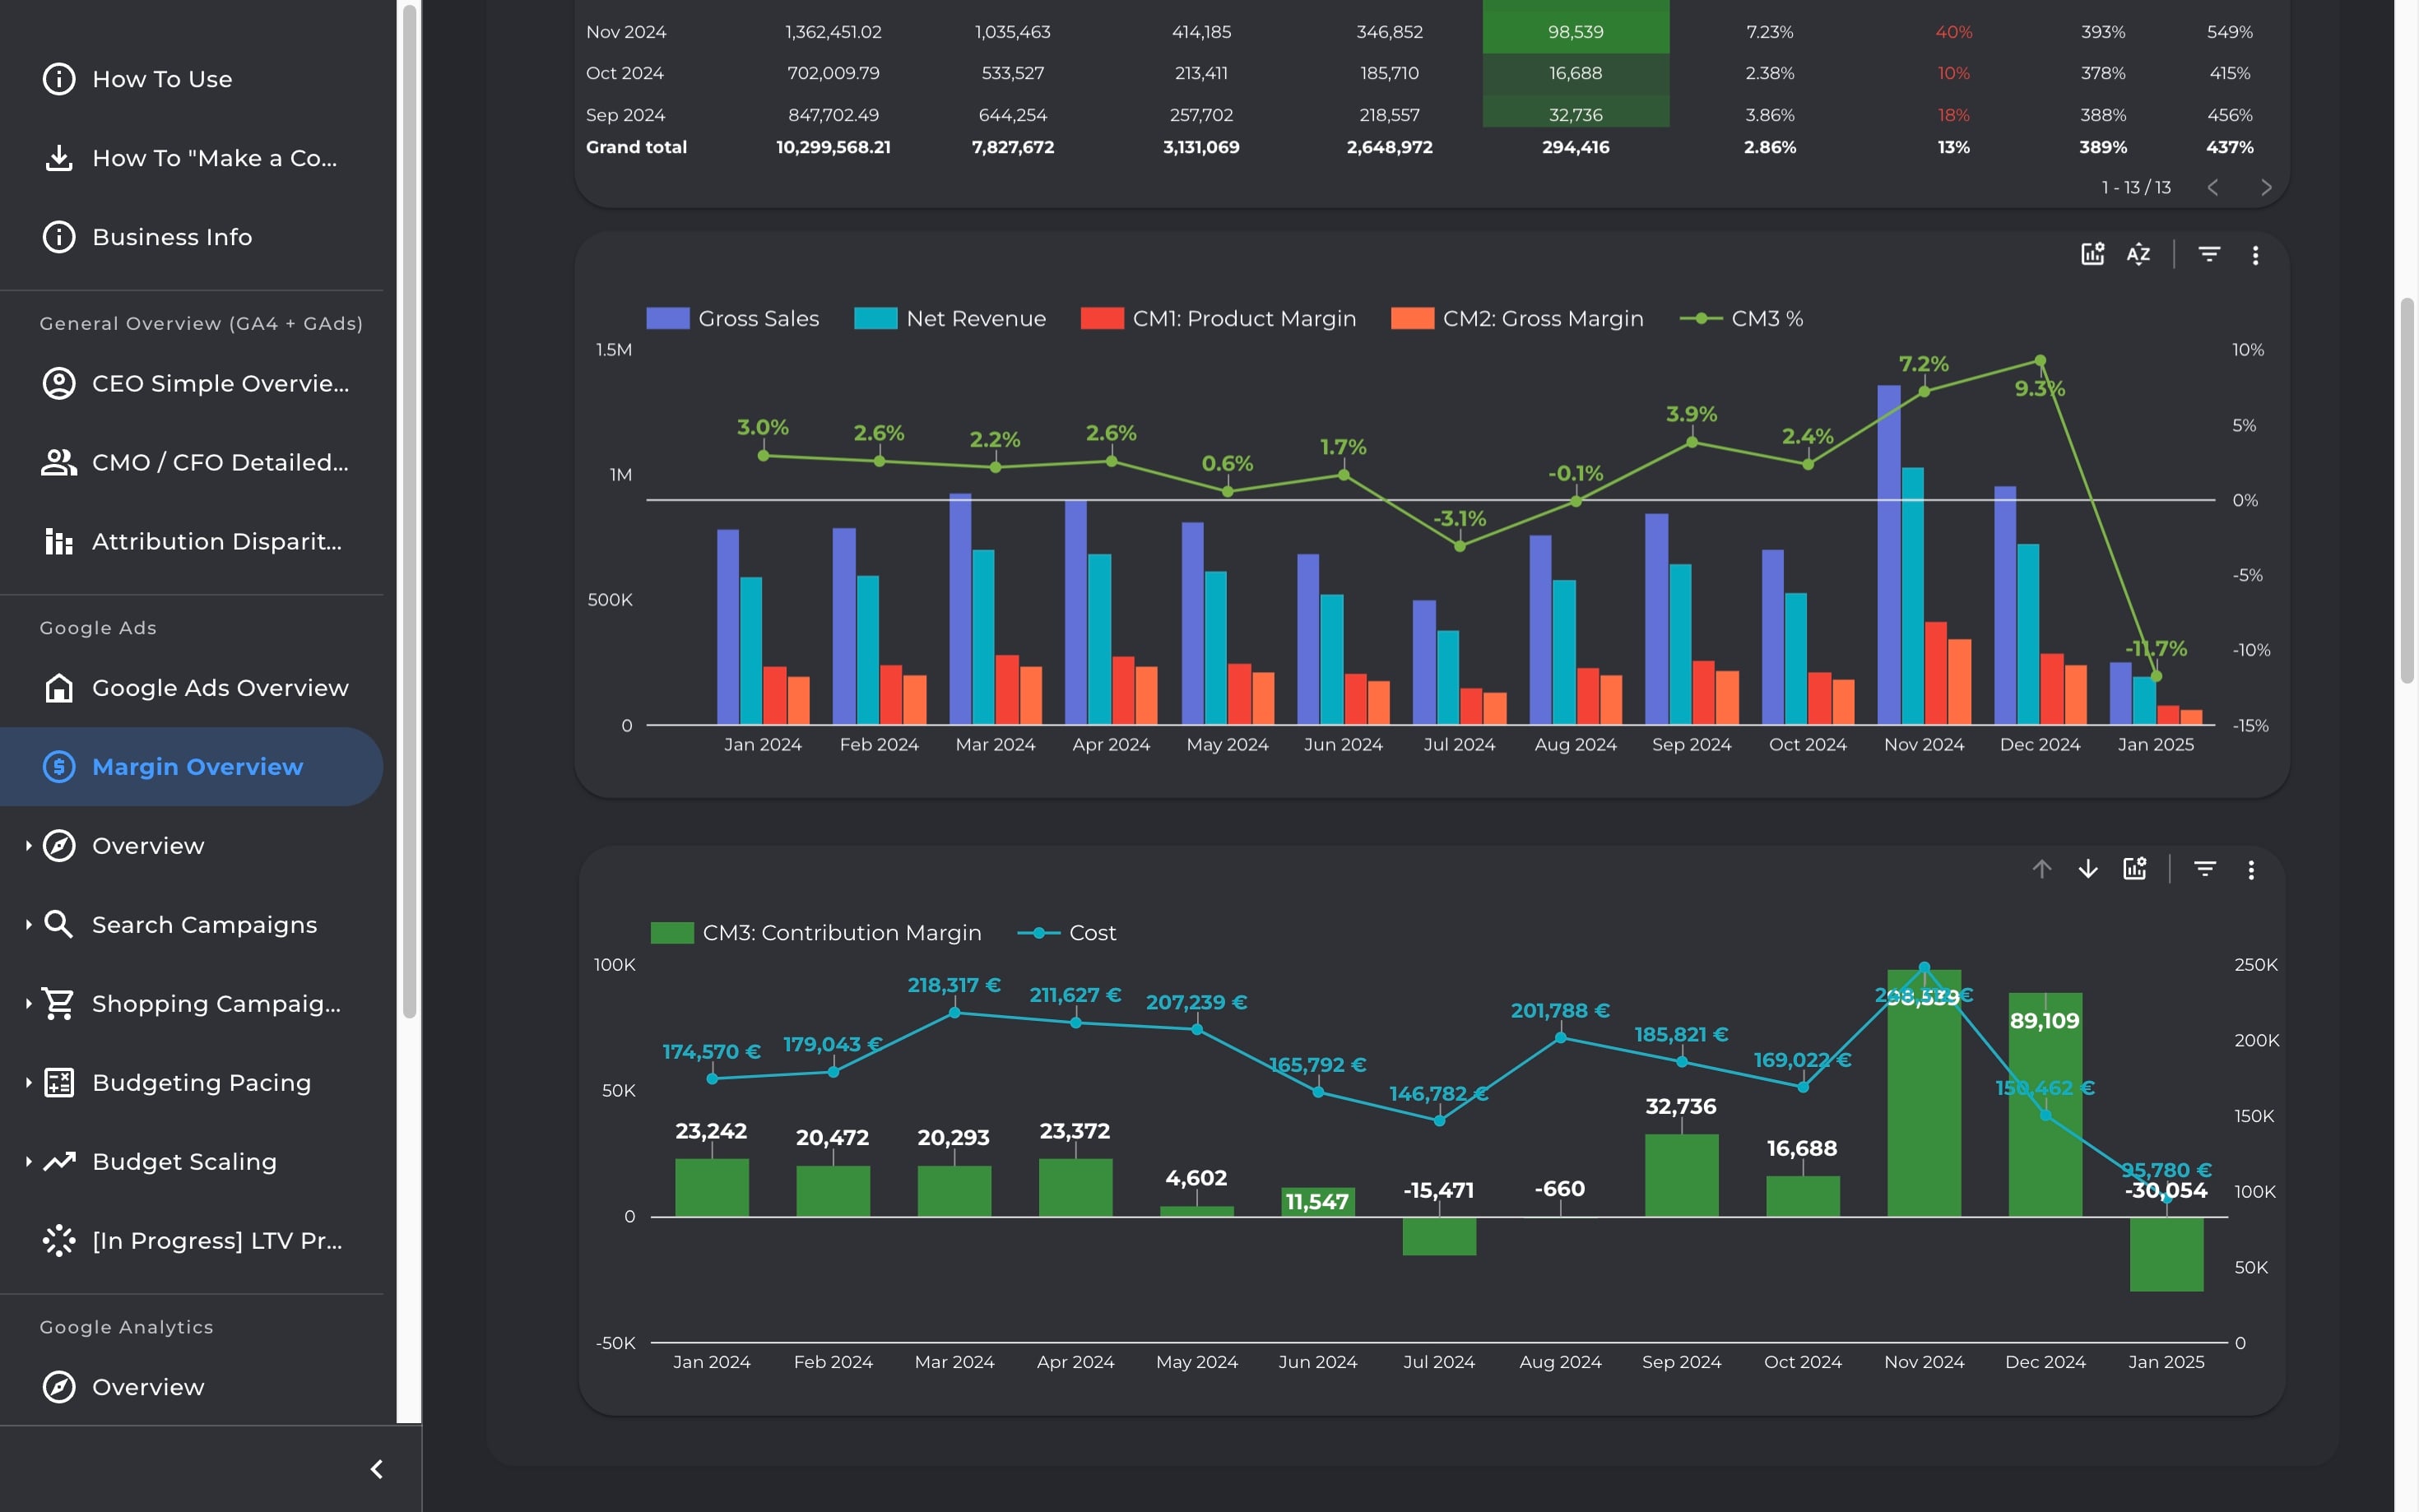
Visualize the full flow from sales to profit with a 3-tier margin breakdown. Estimate contribution margin and break-even ROAS to make smarter, finance-aligned marketing decisions.
Visualize the full flow from sales to profit with a 3-tier margin breakdown. Estimate contribution margin and break-even ROAS to make smarter, finance-aligned marketing decisions.
Visualize the full flow from sales to profit with a 3-tier margin breakdown. Estimate contribution margin and break-even ROAS to make smarter, finance-aligned marketing decisions.
Visualize the full flow from sales to profit with a 3-tier margin breakdown. Estimate contribution margin and break-even ROAS to make smarter, finance-aligned marketing decisions.
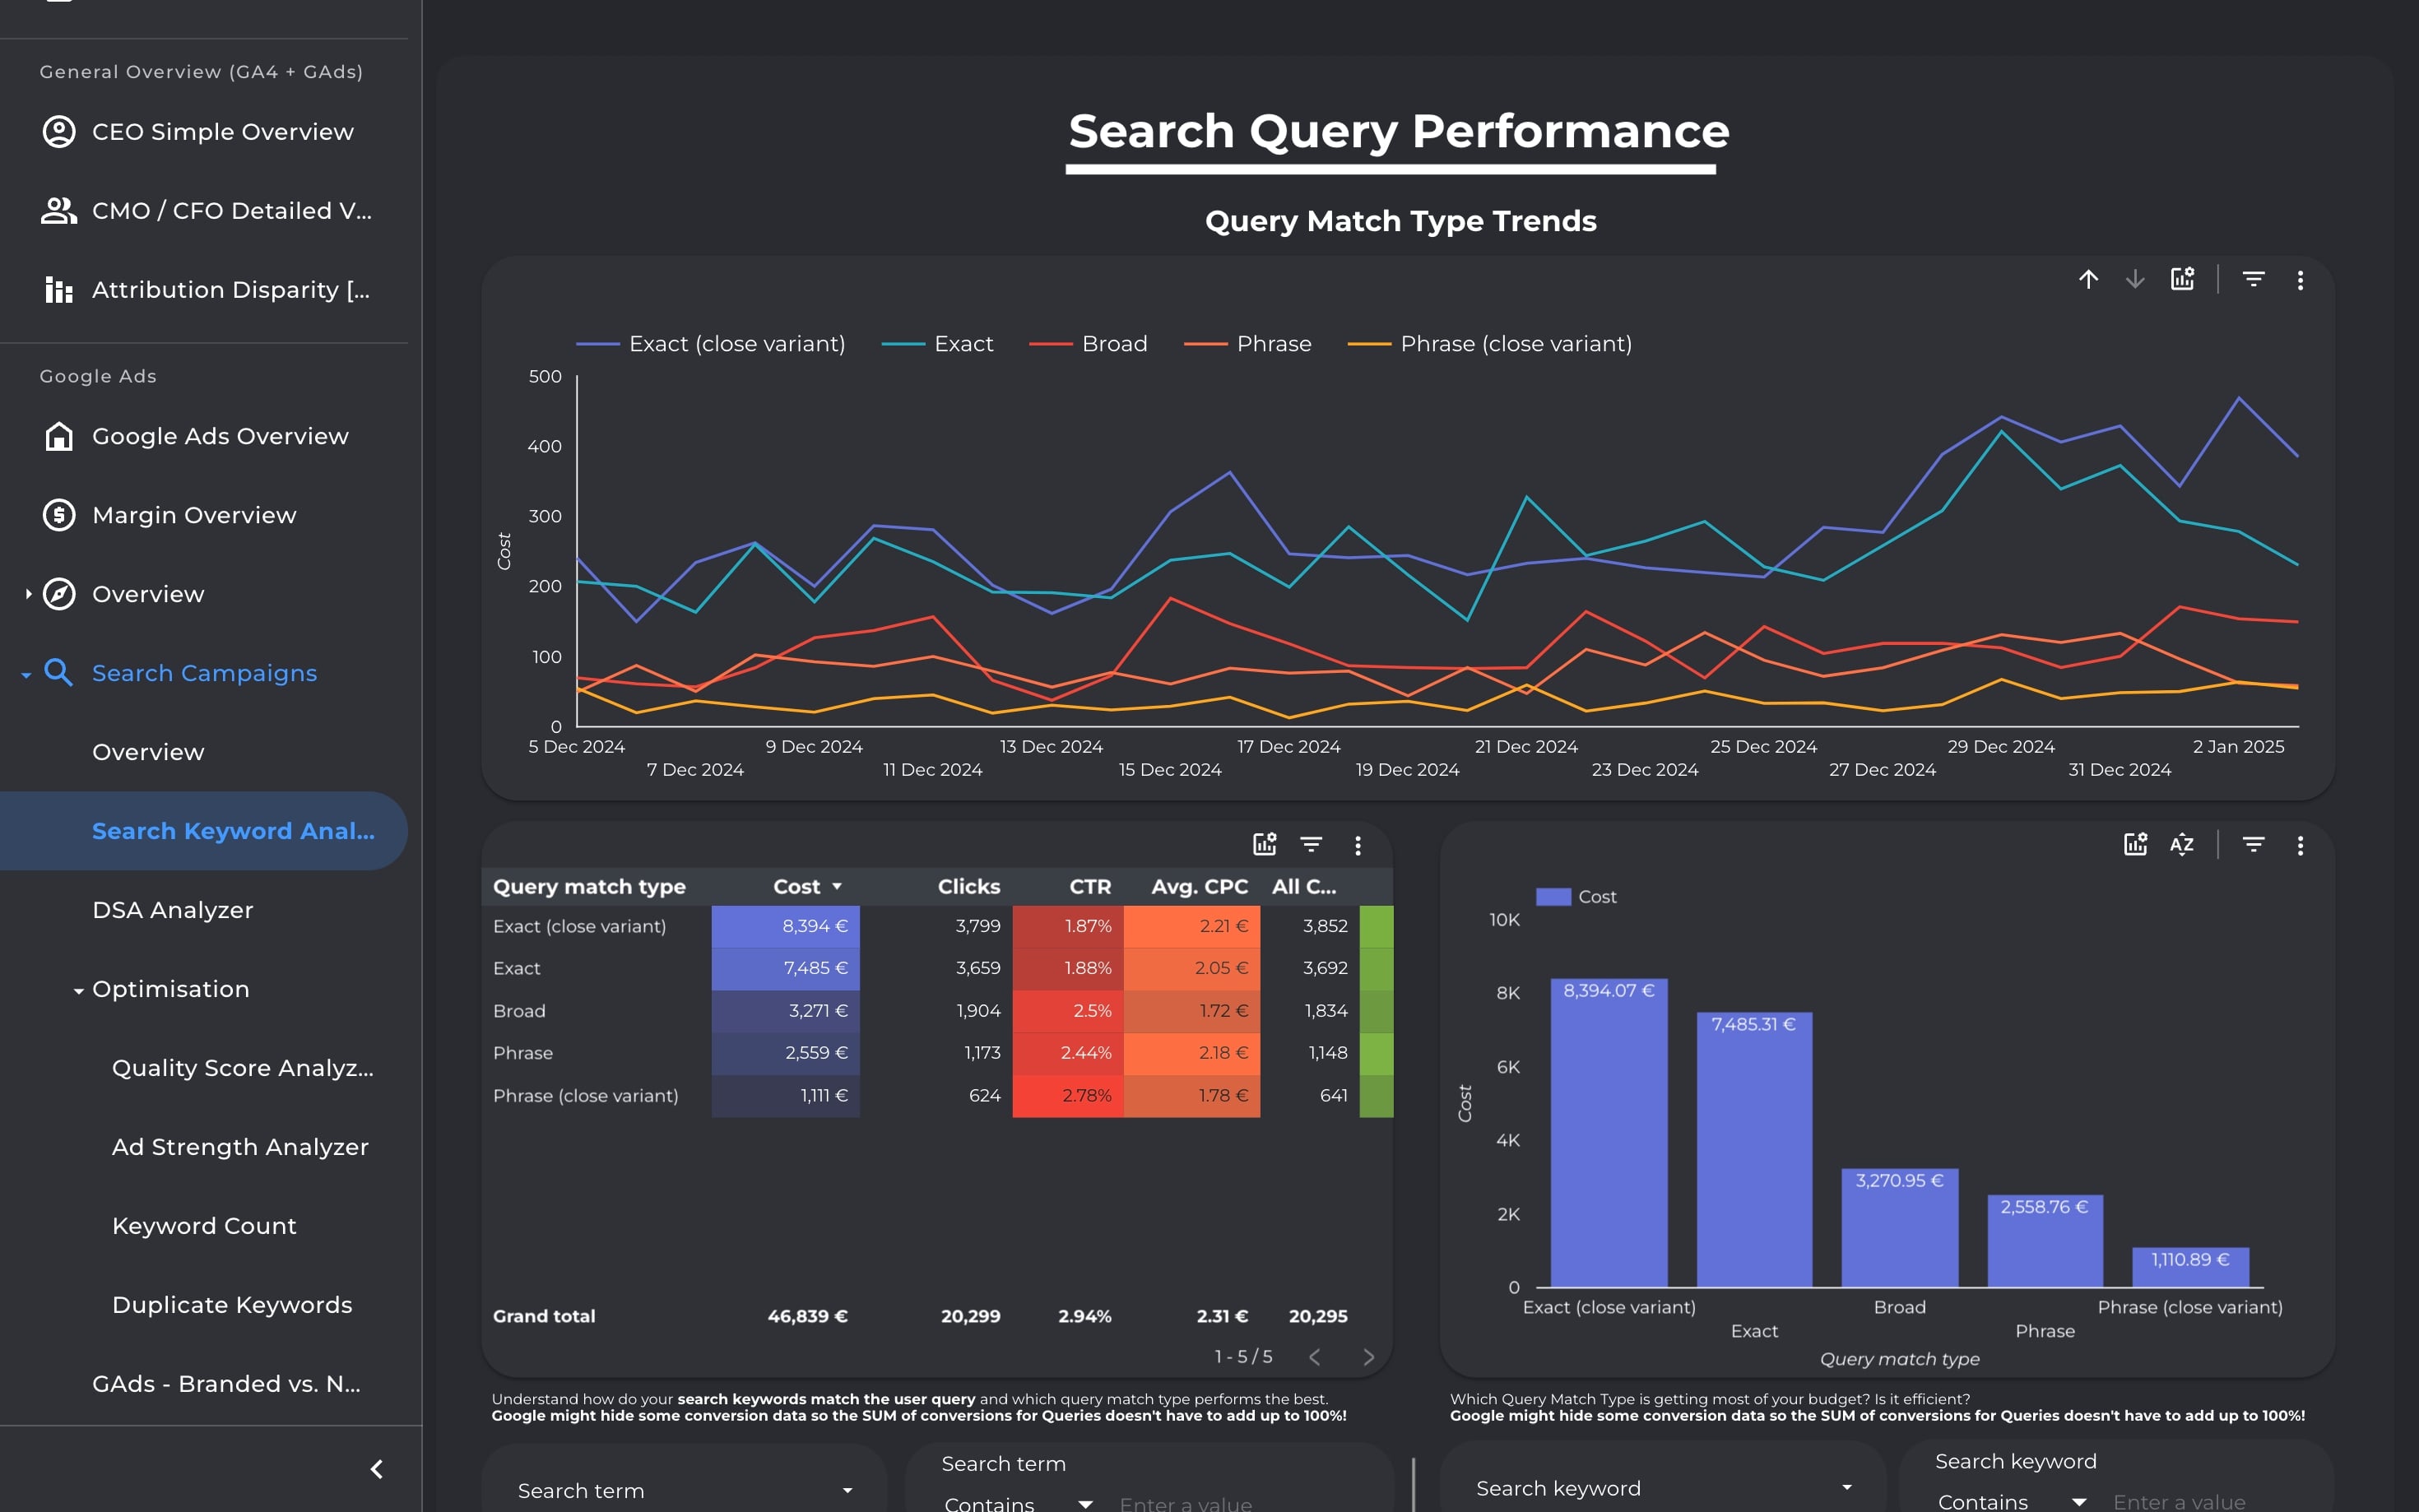
Diagnose and optimize your Search Ads campaigns from every angle—keywords, queries, match types, DSA, structure, and scoring. Identify waste, improve ROI, and simplify with data-backed decisions.
Diagnose and optimize your Search Ads campaigns from every angle—keywords, queries, match types, DSA, structure, and scoring. Identify waste, improve ROI, and simplify with data-backed decisions.
Diagnose and optimize your Search Ads campaigns from every angle—keywords, queries, match types, DSA, structure, and scoring. Identify waste, improve ROI, and simplify with data-backed decisions.
Diagnose and optimize your Search Ads campaigns from every angle—keywords, queries, match types, DSA, structure, and scoring. Identify waste, improve ROI, and simplify with data-backed decisions.
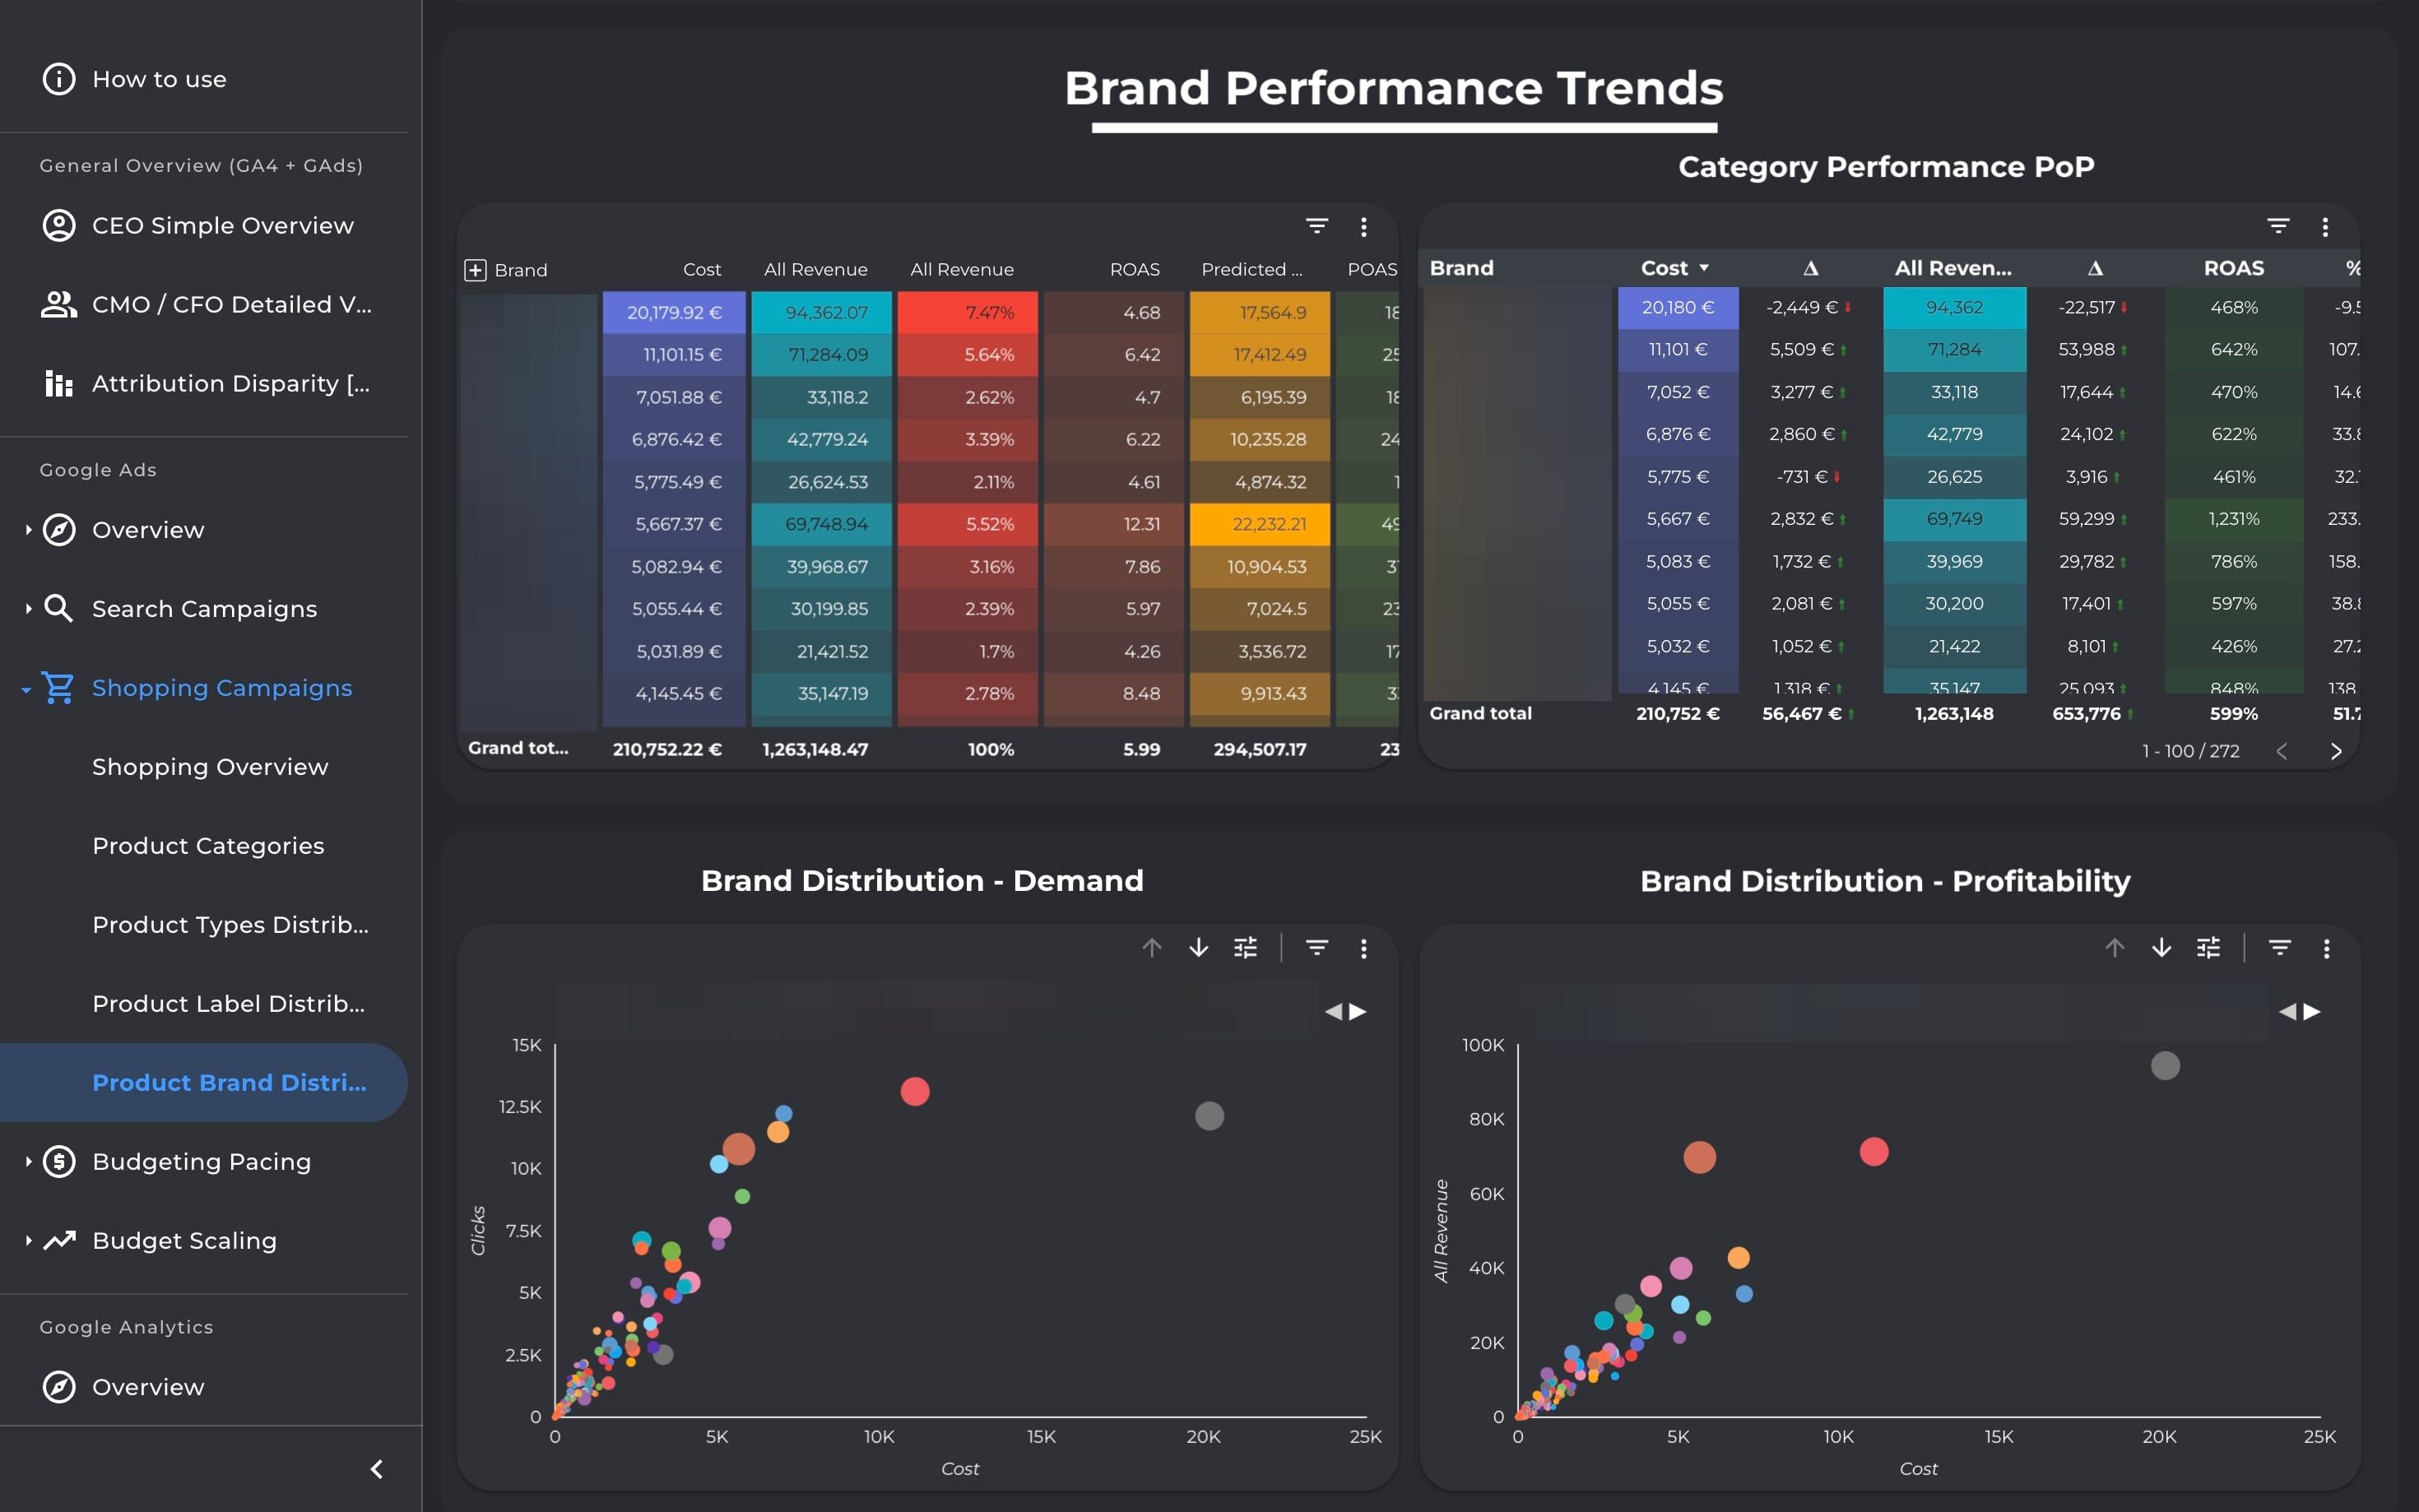
Analyze Shopping & PMax campaign profitability at product level. Drill into categories, brands, and labels to surface bestsellers, optimize structures, and align spend with scalable, high-margin products.
Analyze Shopping & PMax campaign profitability at product level. Drill into categories, brands, and labels to surface bestsellers, optimize structures, and align spend with scalable, high-margin products.
Analyze Shopping & PMax campaign profitability at product level. Drill into categories, brands, and labels to surface bestsellers, optimize structures, and align spend with scalable, high-margin products.
Analyze Shopping & PMax campaign profitability at product level. Drill into categories, brands, and labels to surface bestsellers, optimize structures, and align spend with scalable, high-margin products.